Model Download: Our global model YB13SVani can be found here the local reference models used (PREM + CRUST2.0) can be downloaded here.
Citation:
![]() *Yuan, K., and Beghein, C., Seismic anisotropy changes across upper mantle phase transitions, Earth and Planet. Sci. Lett., 374, 132-144, doi: 10.1016/j.epsl.2013.05.031, 2013 – Article usage report here
*Yuan, K., and Beghein, C., Seismic anisotropy changes across upper mantle phase transitions, Earth and Planet. Sci. Lett., 374, 132-144, doi: 10.1016/j.epsl.2013.05.031, 2013 – Article usage report here

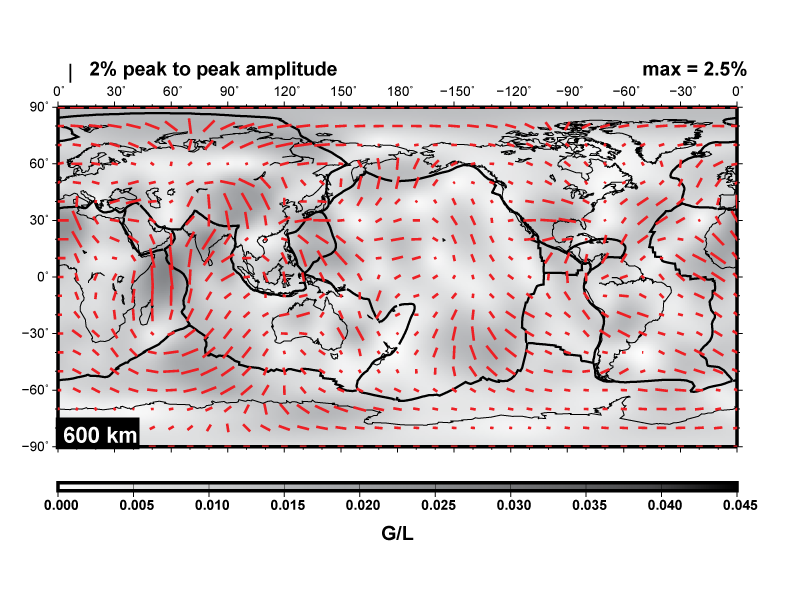
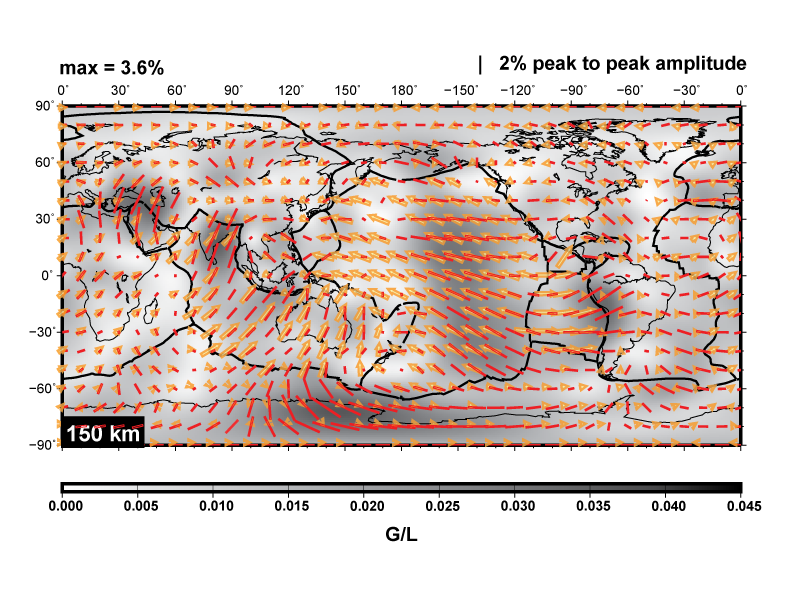
The red bars in the maps above represent the fast direction of propagation for vertically polarized S-waves, and is generally considered a good proxy for mantle flow direction in the uppermost mantle. We see that the fast axes direction is generally different in the transition zone and that the change occurs at the TZ boundaries. This could indicate changes in mantle flow. However, the relation between seismic anisotropy and flow at these depths is unknown and the change in seismic anisotropy could simply result from recrystallization during the phase change even if flow direction does not change.