MODEL DOWNLOAD
Come back later…
Citation:
![]() Beghein, C., Trampert, J., and H.J. van Heijst, Radial anisotropy in reference models of the mantle, J. Geophys. Res., 111, B02303, doi:10.1029/2005JB003728, 2006
Beghein, C., Trampert, J., and H.J. van Heijst, Radial anisotropy in reference models of the mantle, J. Geophys. Res., 111, B02303, doi:10.1029/2005JB003728, 2006
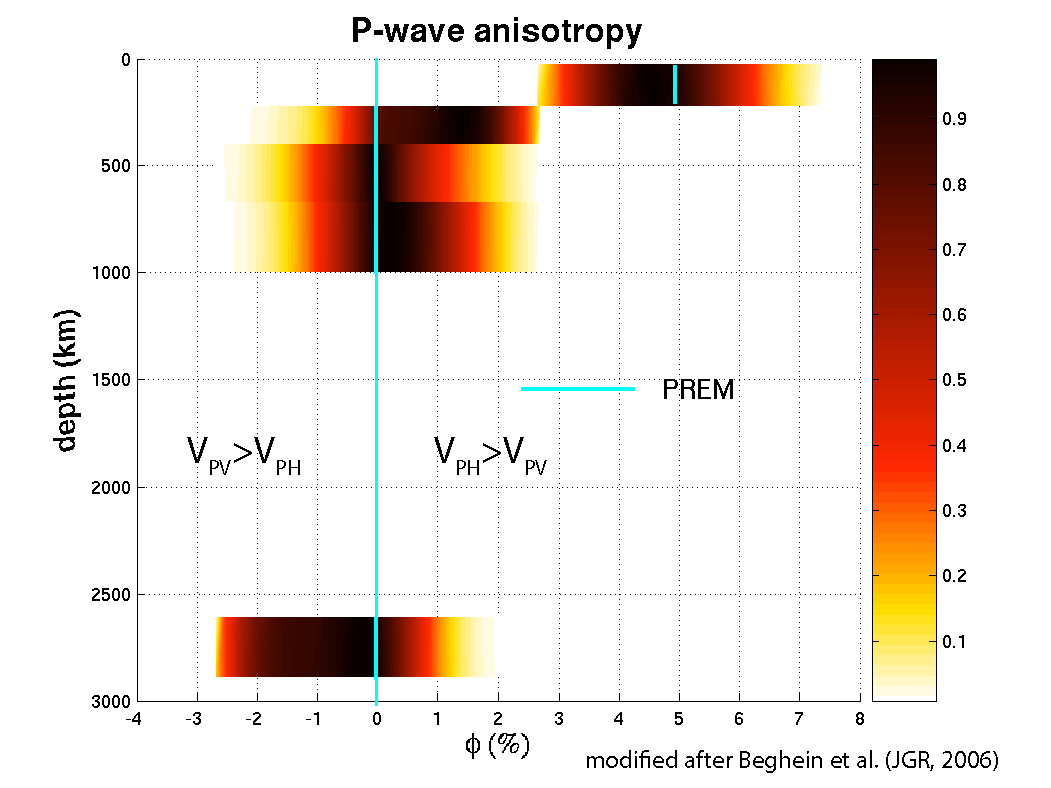
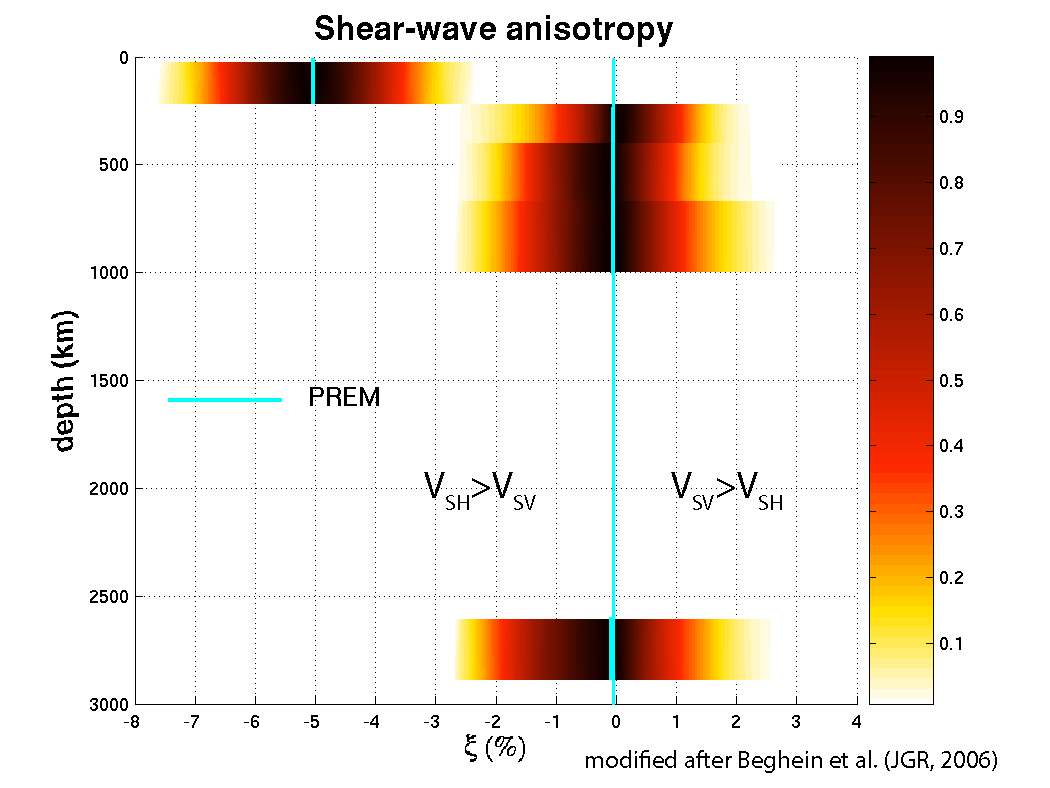
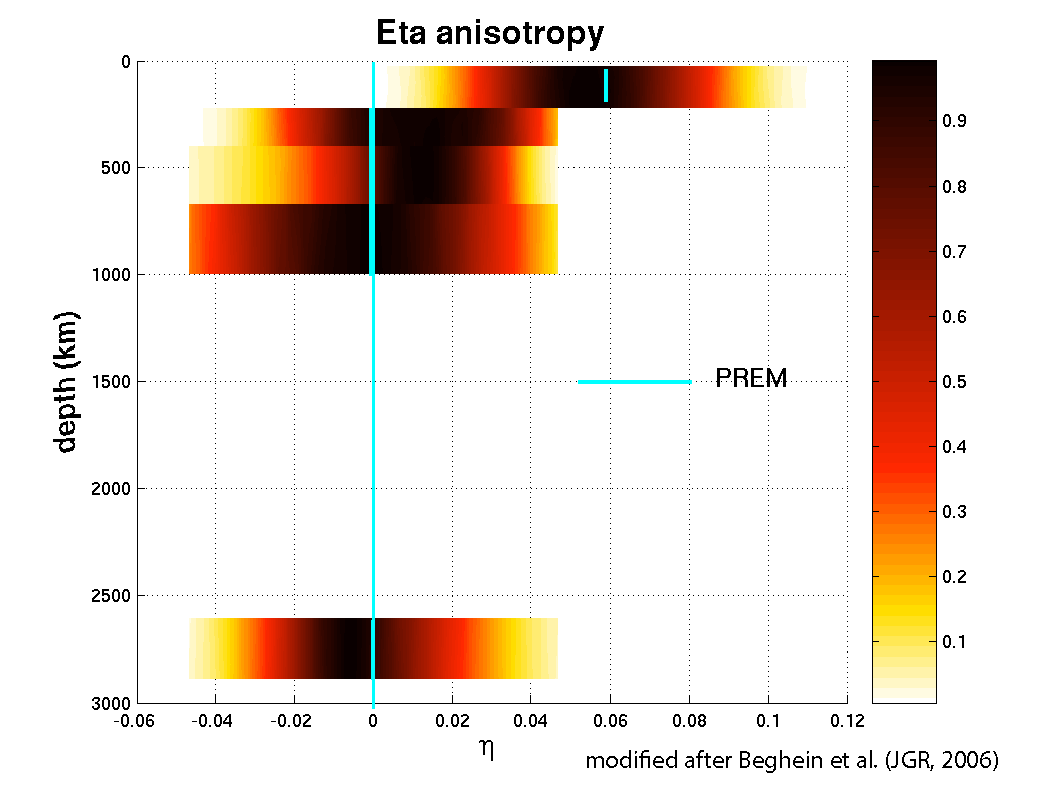
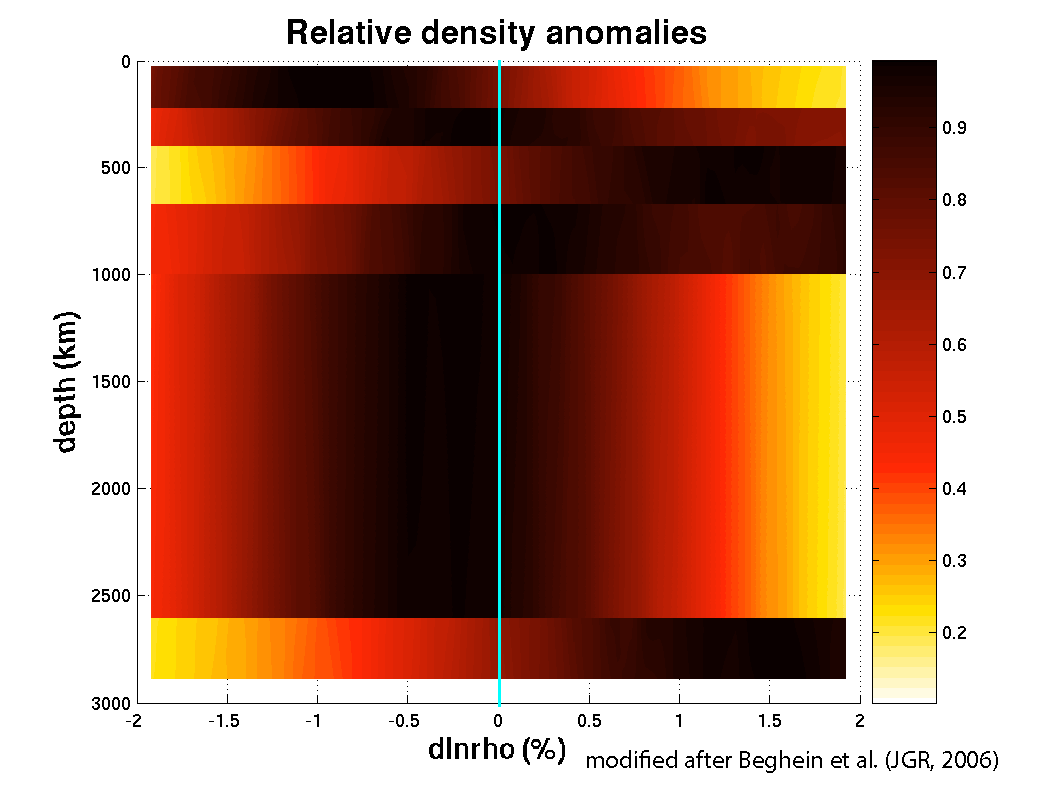
The figures below represent distributions of 1-D anisotropy models as a function of depth. They were constrained by normal modes and surface wave fundamental and higher modes. The blue line corresponds to PREM, which is anisotropic in the top 220km. The color scale gives the probability of anisotropy (dark regions show the most likely value of anisotropy). The posterior model distributions were not Gaussian and some of these ppdfs are skewed.
Summary of our results:
-
PREM still gives a very good fit to the data and is close to the most likely solution
-
There a slight preference of the data for VSH>VSV between 410km and 1000km depth, and possibly in D”
-
Stronger departure from PREM for P-waves and η anisotropy
-
Likely anti-correlation between P- and S-wave anisotropy in D”
-
Density poorly constrained but preference for less dense uppermost mantle and denser MTZ. The data also require a denser D”, which could be the signature of the post-perovskite phase

This work was presented at the following meetings and conferences:
Beghein, C., Trampert, J., and van Heijst, H.J., Anisotropy in 1D reference mantle models, EGU, Vienna, Austria, Abstract, 2005.