The consistency of the Polar data with the centrifugal acceleration process will be demonstrated by computing, backward in time to the ionosphere, the trajectories of the O+ ions measured just before- (at
![]() = 2345:18 UT) and just after- the compression (at
= 2345:18 UT) and just after- the compression (at
![]() = 2347:18 UT). The following guiding-center equations of motion were used:
= 2347:18 UT). The following guiding-center equations of motion were used:
![]()
![]()
Here,
![]() and
and ![]() are the parallel and perpendicular velocity components of the guiding center.
are the parallel and perpendicular velocity components of the guiding center.
![]() is the gravitational potential. M is the magnetic moment (circular energy/B), which was assumed to be constant during the motion, and m is the ion mass. The gradient and curvature drifts, which are all small, were neglected.
is the gravitational potential. M is the magnetic moment (circular energy/B), which was assumed to be constant during the motion, and m is the ion mass. The gradient and curvature drifts, which are all small, were neglected.
![]() was related to the perpendicular drifts,
was related to the perpendicular drifts,
![]() , shown in Figure 2 by the equations,
, shown in Figure 2 by the equations,
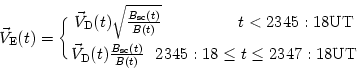
where
![]() and B are the field intensities at the spacecraft and the ion position, respectively. The magnetic field lines were assumed to be equipotentials. Consequently, at t <2345:18 UT the ion drifts measured at the satellite were multiplied by
and B are the field intensities at the spacecraft and the ion position, respectively. The magnetic field lines were assumed to be equipotentials. Consequently, at t <2345:18 UT the ion drifts measured at the satellite were multiplied by
![]() , which is the ratio of the field-line spacing at the ion position to that at the spacecraft. During the time interval of the compression, the ions observed at
, which is the ratio of the field-line spacing at the ion position to that at the spacecraft. During the time interval of the compression, the ions observed at
![]() were in regions of lower field intensity toward the magnetopause, where the convection velocity of the field was larger that it was at the spacecraft. By plotting field lines for different solar wind pressures, we found the convection velocity along the trajectory to be approximately inversely proportional to
were in regions of lower field intensity toward the magnetopause, where the convection velocity of the field was larger that it was at the spacecraft. By plotting field lines for different solar wind pressures, we found the convection velocity along the trajectory to be approximately inversely proportional to ![]() . Therefore,
. Therefore,
![]() , was multiplied by an additional factor of
, was multiplied by an additional factor of
![]() .
.
The magnetic moment was so small that only an upper limit of the circular energy of the O+ ions could be estimated from the O+ perpendicular-temperature derived from the TIMAS measurements. Accordingly, trial values of the magnetic moment were used to compute the trajectory of the ion observed at
![]() backward in time, and the magnetic moment was selected as that value (
backward in time, and the magnetic moment was selected as that value (
![]() eV/T) which caused the ion to mirror at an altitude of 500 km in the ionosphere. This value of the magnetic moment was consistent with the upper limit imposed by the measurements. The same value of the magnetic moment was used to compute the trajectory of the ion measured at
eV/T) which caused the ion to mirror at an altitude of 500 km in the ionosphere. This value of the magnetic moment was consistent with the upper limit imposed by the measurements. The same value of the magnetic moment was used to compute the trajectory of the ion measured at
![]() .
.
The ion trajectories were computed in Tsyganenko's 1996 magnetic field model [Tsyganenko, 1995] using a predictor-corrector routine. Among the input parameters to this model are the Dst index, the IMF
![]() and
and
![]() components, and the solar wind pressure, P. From
components, and the solar wind pressure, P. From
![]() to
to
![]() these input values were changed incrementally, in 6s intervals, from (Dst,
these input values were changed incrementally, in 6s intervals, from (Dst,
![]() ,
,
![]() , P) = (-45 nT, 38.9 nT 6.2 nT, 15 nPa) to (-45 nT, 11.5 nT -1.2 nT, 2.6 nPa). (These parameters are discussed by Russell et al. [1999]).
, P) = (-45 nT, 38.9 nT 6.2 nT, 15 nPa) to (-45 nT, 11.5 nT -1.2 nT, 2.6 nPa). (These parameters are discussed by Russell et al. [1999]).