Figure 1: Energy per unit charge (keV/e) of H+, O+, He+, and He++ as a function of time. The color code at the right indicates the ion flux [cm
]
Figure 2: Polar measurements: (a) magnetic field magnitude and components; (b) ion drift components perpendicular to ; (c) parallel H+ and O+ velocity components and the local magnitude of the centrifugal acceleration term (blue line).
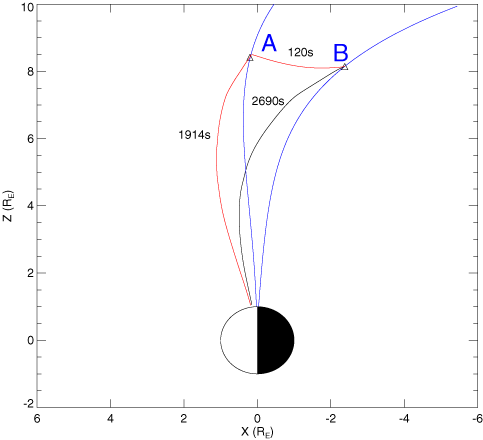
Figure 3: Projections in the (X, Z)
plane of backward-traced trajectories of O+ ions measured at point B by TIMAS before (black curve) and after (red curves) the compression (see text).