Sudden Compression of the Outer Magnetosphere Associated with an Ionospheric Mass Ejection
C. T. Russell1, X. W. Zhou1, P. J. Chi1, H. Kawano2, T. E.
Moore3, W. K. Peterson4
J. B. Cladis4 and H. J. Singer5
1Institute of Geophysics and Planetary Physics, University of California, Los Angeles, CA
90095-1567, USA
2
Kyushu University 33, Fukuoka, Japan
3
Goddard Space Flight Center, Greenbelt, MD 20771, USA
4
Lockheed Martin, Palo Alto Research Lab., Palo Alto, CA 94304, USA
5
NOAA R/E/SE, Boulder, CO 80303, USA
Originally Published In:
Geophys. Res. Lett., 26, 2343-2346, 1999.
Abstract
On September 24, 1998 at 2345 UT the magnetosphere was suddenly compressed as the dynamic pressure of the
solar wind rapidly rose from 2 to 15 nPa. At the Polar spacecraft, at high altitudes above the center of the
northern polar cap, a remarkably smooth increase in the field strength occurred while the plasma properties
changed abruptly, as described in an accompanying paper. Comparisons with models and an examination of the wave
amplitudes during the compression indicate that the initial change in plasma properties was most probably due to
convection of pre-existing boundary layer plasma to the location of Polar rather than due to local heating by
betatron acceleration and ion cyclotron waves. The smoothness of the increase in field strength is attributed to
the very high velocity of compressional waves in the tail that outrun the advancing solar wind disturbance. The
signatures as measured by GOES 10 at 1444 LT and at GOES 8 at 1846 LT in low latitude geosynchronous orbit are the
more familiar sudden jump on the dayside, where the density is high and the compressional wave velocity low, and a
weak change on the nightside, where tail current changes oppose the effects of the dayside magnetopause currents.
This event is an ideal candidate for collaborative investigation of the effects of a classical sudden storm
commencement on the magnetosphere.
Introduction
When the solar wind dynamic pressure suddenly increases, the magnetosphere is compressed beginning at the
dayside magnetopause and then continuing down the tail [see e.g. Wilken et al., 1982]. If this compression occurs
during a period of northward interplanetary magnetic field (IMF) we expect that the principal change in the
magnetosphere will be to shrink in size and increase its magnetic field strength accompanied by rapid motion of
the plasma "tied" to those field lines. At a spacecraft, high over the polar cap we expect to see an increase in
the magnetic field unless the spacecraft leaves the magnetosphere proper. Likewise, in the dayside magnetosphere,
the magnetic field will increase almost everywhere, although on the nightside the magnetic field may weaken as the
magnetosphere is compressed [Wing and Sibeck, 1997]. Of great interest also is the reaction of the ionospheric
plasma to such compressions. Ionospheric flows seen above the polar cap could be enhanced by extra dissipation in
the ionosphere [Pollock et al., 1990] and by local acceleration processes such as ion cyclotron heating, betatron
acceleration, and centrifugal acceleration [Cladis, 1986]. Changes can also occur as the spacecraft "moves" much
closer to boundaries and finds itself in new plasma regimes, such as those in the magnetopause boundary layer.
On September 24, 1998, approximately at 2345 UT, a sudden compression of the magnetic field occurred that
increased the magnetic field from 125 to 180 nT while the Polar spacecraft was at high altitude in the center of
the northern polar cap, 8.9 RE from the center of the Earth. The sudden compression was also detected
at the two synchronously orbiting spacecraft GOES 8 and 10 at 1846 LT and 1444 LT respectively. Simultaneous with
this compression, the thermal plasma escaping from the ionosphere underwent major changes at Polar as documented
in the accompanying paper [Moore et al., 1999]. For several hours prior to the event the polar wind flowed
steadily along the field with a H+ flow energy of about 12 eV and an of O+ flow energy of
about 120 eV. During the compression the flow turned perpendicular to the field, returning to field aligned after
the event, at an increased outflow velocity and an increased temperature. The most rapid changes occurred so
quickly that they must involve the plasma already in the lobes of the magnetosphere. By examining the field
compression and the waves present we can determine what processes were involved in the changes observed. By
comparing the enhancement of the field at Polar and the two GOES spacecraft we gain insight into how a compression
of the magnetosphere takes place.
Observations
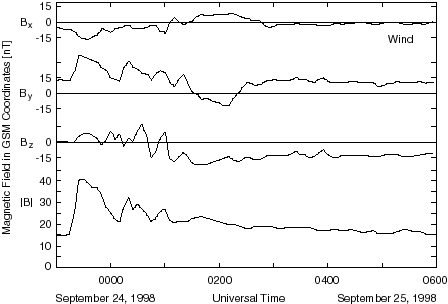
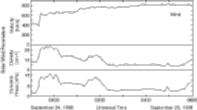
The solar wind conditions as measured by Wind around the time of the sudden impulse on Sept. 24, 1998 are given
in Figures 1 and 2. The solar wind velocity suddenly increased from
400 to over 600 km/s and the density jumped from 8 to over 20 cm-3 causing an increase in the dynamic
pressure from 2 nPa to 15 nPa. The interplanetary magnetic field (IMF) was strong and in the positive Y-GSM
direction throughout. At about 0100 UT the field slowly and irregularly rotated from the positive Y-GSM direction
to strongly southward, remaining there until well after 0600 UT. The time delay from Wind to the Earth was about
20 minutes after the shock hit.
 |
 |
| Figure 1. Solar wind parameters measured 185 RE upstream from
the Earth by the Wind spacecraft from 2300 UT on Sept. 24, 1998 to 0600 on Sept. 25.
| Figure 2. Interplanetary magnetic field measured by the Wind
spacecraft for the same period as in Fig. 1.
|
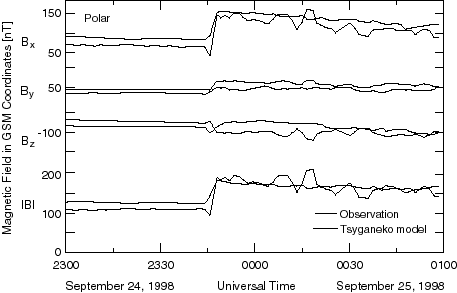
Figure 3 shows the magnetic field in GSM coordinates as seen by the Polar
magnetometer [Russell et al., 1995]. The light line shows the predicted magnetic field from the Tsyganenko 1996
model [Tsyganenko, 1995; 1996]. This model allows us to dynamically predict the expected magnetic field at Polar
using time-shifted solar wind values. This is shown in Figure 3 for the first 75 minutes
after the sudden compression. The heavy line shows the observed field and the light trace is calculated from the
model. Before the arrival of the sudden impulse the observed field is greater than predicted but roughly in the
predicted direction. From the examination of observations in this region over the course of the Polar mission we
believe that this difference is caused by a difference in the shape of the magnetopause assumed in the model from
that actually present in the vicinity of the cusp. After the sudden impulse the magnitudes agree more closely
while the directions differ somewhat. Another obvious difference is that the predicted field values are more time
varying than those observed. It is possible that the structure that caused the predicted compressions did not
intersect the magnetosphere or were smoothed over the interaction cross section and in propagation through the
magnetosphere. Whatever the cause of the differences it is clear that the model does not predict correctly the
short term (10 min) response of the magnetosphere, especially using a monitor nearly 200 RE upstream.
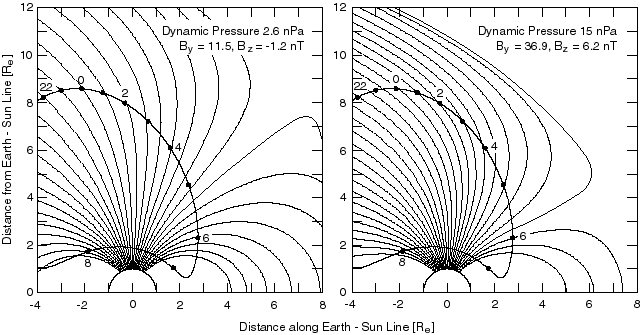
When the sudden compression arrived, Polar was at (-2.40, -2.72, 8.14) RE in GSM coordinates. Figure 4 shows magnetic field lines in the noon-midnight plane from the Tsyganenko 96 model
for a northward magnetic field and a dynamic pressure of 2.6 nPa (on the left) and for a dynamic pressure of 15
nPa (on the right) representative of the conditions after the passage of the interplanetary shock. Superimposed
on this plot is the orbit of the Polar spacecraft rotated into this plane. As shown in Figure
3 the magnetic field increase occurs principally in the X and Y components. After an initial perturbation the
Z component returns to close to its previous value. Figure 4 indicates how to interpret
the change between the pre and post compression states. Close to the magnetopause the magnetic field is
tangential to the boundary, but far from the boundary and near field lines emanating from the center of the polar
cap the magnetic field points more toward the dipole axis, i.e. more vertically downward. When the solar wind
pressure increased, the magnetopause moved in toward Polar. The field was compressed and rotated to lie more
nearly parallel to the compressed magnetopause. The effect of the compression and rotation were both in the
direction to increase Bx but the compression and rotation had opposite effects on Bz, nearly canceling. From a
comparison of the two panels of Figure 4 we estimate that the plasma moved about 2
RE during the compressional event. The compression took place in about 100 s at Polar. Thus the
velocity of the plasma in the direction perpendicular to the magnetic field must have been about 100 km/s. This
speed is similar to the cross-field flow observed by the TIDE and TIMAS instruments, during the field compression
[Moore et al., 1999].
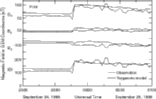 |
Figure 3. Time series in GSM coordinates of the observed (heavy line) and
predicted (light line) magnetic field at Polar from Sept 23, 1998 2300 to Sept 25, 0100. Predictions use the
Tsyganenko 96 model time shifted to Polar using the observed Wind solar wind conditions. Polar was at high
altitudes above the center of the polar cap at this time at
(-2.40, -2.72, 8.14) RE in GSM coordinates. |
The velocity and temperature of the plasma changed abruptly when the compression reached Polar [Moore et al.,
1999]. While our analysis above indicates a large translation of the plasma occurred, possibly moving Polar into
a new plasma regime, we should also examine the alternate possibility that the changes are due to local processes.
First the observed magnetic field increase of 46% should have caused some betatron acceleration of the plasma
but, since the plasma was principally a cold beam flowing parallel to the field, the expected betatron effect is
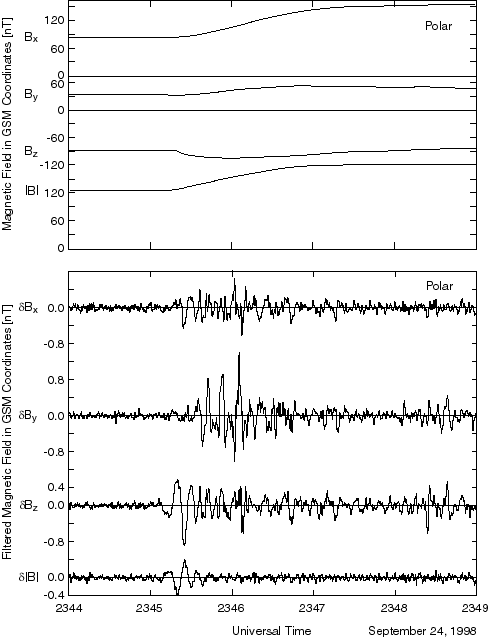
small. Another possible source of heating is the absorption of wave energy. The top panels of figure 5 shows the
five minutes of Polar magnetic field data across the field rise. It is very smooth. The bottom panels of Figure 5 shows the same data bandpass filtered. No other waves were present in the passband
of the instrument, up to 4.2 Hz. As the compressional front begins to cross Polar a 10-second compressional wave
first appears. The local proton gyro frequency at this time is 1.9 Hz. Thus this wave is close to the oxygen
gyro frequency. The wave grows to about 2 nT peak-to-peak, is left-handed and becomes completely transverse over
the next two minutes. However, neither the compressional nor the transverse waves are of sufficient amplitude to
cause much heating of the plasma. The rms amplitude of the waves is only 0.3 nT and at the local Alfven velocity
would only transport about 4 x 10⁻⁸ Watts/m2. This would not cause significant heating
unless absorbed in a rather small volume of plasma.
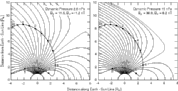 |
Figure 4. Location of Polar in Tsyganenko's model (left) before the compression;
(right) after the compression. |
A major effect of the compression was to increase the velocity components of the plasma ions in the direction
antiparallel to the magnetic field [Moore et al., 1999]. The velocities of H+ and O+ were
both increased about 75 km/s along this direction as observed by the TIDE and TIMAS instruments. A candidate
mechanism for this acceleration is the centrifugal force resulting from the change in the orientation of the
magnetic field as shown in Figures 3 and 5, as first described by
Cladis [1986]. In short, while major changes were observed in the plasma, these changes seem to be due to
cross-field convection so that Polar entered a new plasma regime and to centrifugal acceleration so that plasma
moved along the field faster. Betatron acceleration and subsequent ion cyclotron wave generation seem not to be
important here.
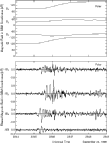 |
Figure 5.(Top panels) Time series of the magnetic field at a time resolution of
120 ms in solar magnetospheric coordinates from 2344 to 2349 UT on Sept 24. (Bottom panels) Band pass filtered
time series in GSM coordinates. Corner frequencies on the filter are 0.07 Hz and 1.0 Hz. No other waves were
observed within the passband of the instrument. |
GOES 8 and 10 Observations
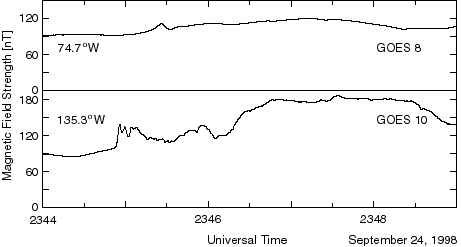
The two operational GOES synchronous orbiters also saw this compressional event as shown in Figure 6. The signatures are in stark contrast to the profile seen at Polar. A sharp
magnetic field increase was seen at GOES 10 at 1444 LT, almost 30 seconds in advance of the compression at Polar.
The compression at GOES 8 at 1846 LT was much weaker than either GOES 10 or at Polar and delayed about 5 seconds
after Polar. The sharp increase at GOES 10 appears to be due to the slower propagation velocity of the wave in
the denser dayside magnetosphere so that a shock-like feature is formed. While we do not know the density at GOES
10, if it were greater than 4 amu/cc, it would slow the compressional wave to below that of the interplanetary
disturbance. At Polar the field can respond nearly instantaneously to the "slowly" changing magnetopause
compression because the speed of waves is high in the low density lobe. The magnetic field at GOES 8 on the
evening side of the magnetosphere also responds to tail currents. These counterbalance the increase in field
strength due to the magnetopause currents. This difference in the day-night response to solar wind compressions
is as expected from previous studies such as that by Wing and Sibeck [1997].
 |
Figure 6.Magnetic field strength as a function of time at the two GOES
spacecraft over the same time interval as shown in Figure 5. |
Summary and Conclusion
The sudden compression of the magnetosphere on September 24, 1998 led to an increase in the magnitude of the
field, a rotation of the magnetic field at the Polar spacecraft and a translation from the center of the polar cap
closer to the magnetopause. Ion cyclotron waves near the oxygen gyro frequency were observed but they were too
small to cause significant heating of the plasma. Nevertheless the plasma changed rapidly as the compression
occurred. Since the plasma seen prior to the compression was flowing mainly parallel to the field, significant
betatron emission is ruled out. The only possible significant local acceleration mechanism is the centrifugal
acceleration of the parallel flowing ions as proposed by Cladis [1986] but this mechanism does not heat the ions.
Thus, to explain the temperature increase observed the spacecraft must have entered a new plasma regime. Clearly
the spacecraft and the magnetopause moved closer as a result of the compression. This increased proximity to the
boundary is consistent with the change in the magnetic field direction, so we interpret the change in the plasma
properties at Polar as the entry into the boundary layer plasma.
Finally, the comparison of observations at Polar and the two GOES satellites show the very large differences in
the response to a rapid compression in the different regions of the magnetosphere. The dayside experiences a
rapid shock-like compression and the evening sector almost no change. The difference in the amplitude of the
response at geosynchronous orbit has been studied before [Wing and Sibeck, 1997] and is due to the competing
effects of the magnetopause and tail currents. In the polar cap the change was very slow and extremely smooth in
contrast to abrupt increase at GOES 10 . We attribute this difference to the comparatively low speed of the
compressional wave in the equatorial region compared with that in the near vacuum conditions of the center of the
high altitude polar cap. Here the compression of the polar cap magnetic field can quickly outrun the advancing
solar wind disturbance. The observations in this and the accompanying paper barely scratch the surface of the
possible studies of this classical sudden storm commencement. Those interested in further information on this
period of time are encouraged to examine the IACG campaign 2 website at
http://www-ssc.igpp.ucla.edu/IACG/index.html
Acknowledgements: We wish to thank the principal investigator of the WIND solar wind and magnetic field
investigator, K. W. Ogilvie and R. P. Lepping for the use of their key parameter data. The work at GSFC was
supported by the NASA ISTP program under UPN 370-17-43, and at Lockheed Martin by NASA contract NAS5-30302. The
work at UCLA was supported by the National Aeronautics and Space Administration under research grant NAG 5-3171.
References
Cladis, J. B., Parallel acceleration and transport of ions from polar ionosphere to plasma sheet, Geophys. Res.
Lett., 13, 893-896, 1986.
Le, G. and C. T. Russell, Initial Polar magnetic field experiment observations of the low-altitude polar
magnetosphere: Monitoring the ring current with polar orbiting spacecraft, J. Geophys. Res., 103, 17345-17350,
1998.
Moore T. E., W. K. Peterson, C. T. Russell, M. O. Chandler, M. R. Collier, H. L. Collin, R. Fitzenreiter, B.
Giles and C. J. Pollock, Ionospheric mass ejection in response to a coronal mass ejection, Geophys. Res. Lett., in
press, 1999.
Pollock, C. J., M. O. Chandler, T. E. Moore, J. H. Waite, Jr., C. R. Chappell, and D. A. Gurnett, A survey of
upwelling ion event characteristics, J. Geophys. Res., 95, 18969, 1990.
Russell, C. T., R. C. Snare, J. D. Means, D. Pierce and D. Dearborn, The GGS/Polar magnetic fields
investigation, Space Sci. Rev., 71, 1-4, 563-582, 1995.
Tsyganenko, N. A., Modeling the Earth's magnetospheric magnetic field confined within a realistic magnetopause,
J. Geophys. Res., 100, 5599-5612, 1995.
Tsyganenko, N. A., Effects of the solar wind conditions on the global magnetospheric as deduced from data-based
field models, in European Space Agency Publication ESA SP-389, 181-185, 1996.
Wilken, B., C. K. Goertz, D. N. Baker, P. R. Higbie and T. A. Fritz, The SSC on July 29,
1977 and its propagation within the magnetosphere, J. Geophys. Res., 87, 5901-5910, 1982.
Wing, S. and D. G. Sibeck, Effects of interplanetary magnetic field z component and the solar wind dynamic
pressure on the geosynchronous magnetic field, J. Geophys.
Res., 102, 7207-7216, 1997.
 Back to CT Russell's page
 More On-line Resources
Back to the SSC Home Page