Abstract
While at present we are able to deduce from ground records only qualitative properties of the solar wind, in the future quantitative deductions may be possible, in a statistical sense, from an examination of polar cap magnetograms together with records of geomagnetic activity. The qualitative inferences that are possible now indicate several important features of the behavior of the solar wind over the last 100 years. First, there appear to be significant long term changes in either the solar wind velocity, the magnetic field strength, the variability of the field or some combination of all three. Second, a heliographic latitude dependence of these parameters exists, whose amplitude depends on sunspot number. Third, with the exception of the most recent solar cycle, there is little north-south asymmetry in these solar parameters. Finally, there is a double sunspot cycle modulation of geomagnetic activity, the most likely cause of which is a modulation of the interplanetary magnetic polarity with latitude, and which in turn implies the presence of a solar polar magnetic dipole. The amplitude of this modulation has undergone significant changes since 1868, being large then and at the present, but effectively disappearing from 1908 to 1948.
1. Introduction
Since geomagnetic activity is driven by the interaction of the solar wind with the magnetosphere and the strength of this interaction depends on solar wind parameters, one might expect that measurements of geomagnetic activity could be inverted to deduce solar wind parameters. This possibility is all the more attractive because geomagnetic records exist for over 100 years into the past, while in situ measurements exist for only a decade. Thus we might determine whether the present solar wind is representative of the long term average solar wind.
It is not obvious that the solar wind does not undergo long term changes. For example, it has been suggested that the sun might undergo sudden mixing events and that we are in the midst of one now (Fowler, 1972). While the time for recovery from such an event is of the order of 106 yr (Ezer and Cameron, 1972) and should not be evident in records as short as 100 yr, it is conceivable that, if the Sun were in the mixing phase, some measurable change would be present in the data.
It is the purpose of this note to discuss what we can presently determine from geomagnetic records, and what we may be able to determine in the future, and to present some evidence for long term changes in the solar wind and the solar magnetic field.
2. The Causes of Geomagnetic Activity
All successful studies of the cause of geomagnetic disturbances have involved correlations with the southward component of the interplanetary magnetic field. The highest correlations have come when the magnetosphere is treated like a rectifier responding only to southward magnetic fields (cf. Arnoldy, 1971; Garrett et al., 1974; Burton et al., 1974). This occurs because the merging rate of the magnetospheric and interplanetary fields depends strongly on the angle between them such that when the interplanetary field is even slightly northward the merging rate is apparently quite low. The magnetospheric convection rate, i.e., the rate at which magnetic flux is transported to the tail also depends on the merging rate. Thus, phenomena that depend on the convection rate should in turn provide measures of the merging rate. The geomagnetic tail stores convected flux and periodically releases it in substorms. Measures of geomagnetic activity such as the AE and Ap indices therefore respond to the integral of the merging rate over some period of time. Nevertheless, on the time scale of a day or longer, the energy dissipated in the magnetosphere must balance the energy input from the solar wind, and the average AE and Ap indices provide a measure of the average strength of the interaction. (For a recent review of the evidence for the processes discussed here see Russell and McPherron, 1973a.)
At present the exact functional relationship relating the southward component to the merging rate is not clear and it may involve to some extent the magnitude of the east-west component. Much more work is needed in this regard. However, for the purposes of discussion we will call this functional form F(Bs) remembering that it may also involve the other component. Its important feature is that F(Bs) approaches zero for northward field.
The merging rate also depends on the solar wind velocity, but again the exact relationship is not settled. Strong correlations with V F(Bs) have been found (Garrett et al., 1974; Burton et al., 1974) but equally strong evidence has been found for V 2 F(Bs) (Garrett et al., 1974; Murayama, 1974). The important point is that geomagnetic activity apparently depends on the product of a function of the solar wind velocity and of the magnetic field. Thus, any long term increase in geomagnetic activity could have either of three causes. First, the solar wind velocity could have increased; second, the average magnetic field strength could have increased; third, since the interplanetary field is not normally in the north-south direction, and since the magnetosphere acts as a rectifier, the variability of the field could have increased. It is not apparent that these possible sources can be distinguished from geomagnetic activity records alone, but polar cap magnetograms might help in this regard.
3. Polar Cap Magnetograms
Polar cap magnetograms have been shown to be quite sensitive indicators of the polarity of the interplanetary magnetic field (Svalgaard, 1968; Mansurov, 1969; Friis-Christensen et al., 1971). This effect appears to be proportional to the sign and amplitude of the Y-solar magnetospheric component of the interplanetary magnetic field (Friis-Christensen et al., 1972) and has been discussed in terms of polar cap current systems by Jørgensen et al. (1972), Heppner (1972) and Svalgaard (1973). The strength of these currents appears to be independent of the Z-solar magnetospheric component of the interplanetary field, but the location of these currents varies as the size of the polar cap varies in response to changes in Bz (Friis-Christensen and Wilhjelm, 1974). Such control of the polar cap is entirely consistent with modern concepts of an open magnetosphere (Atkinson, 1972; Jørgensen et al., 1972; Russell, 1972; Russell and Atkinson, 1973). The current system most strongly affects the Z or vertical component at high latitude polar cap stations such as Thule (invariant latitude 86.8oN) and the H-component at low latitude polar cap stations such as Godhavn (invariant latitude 77.5o). This effect is seasonal, being strongest when the polar cap is sunlit (Campbell and Matsushita, 1973; Svalgaard, 1973) and its predictive accuracy decreases as a function of latitude, i.e., Thule is better for this purpose than Godhavn. There exist roughly 50 yr of records from polar cap stations but continuous magnetic records at the highest latitudes are only available from about 1962 to the present.
Since this technique apparently could return an instantaneous measurement strictly proportional to the field component, it could provide the capability of studying variations in average field strength, as inferred from the average magnitude of the one component, and the variability of the field. Theoretically, this together with the study of geomagnetic activity could distinguish changes in the solar wind velocity, the field strength and its variability. We note that the ability to carry this out depends critically on the quality of the available records, and even during the best of times, summer near local noon, a one gamma interplanetary solar magnetospheric Y-component gives a ground effect of only 30 nT at Thule.
Svalgaard (1972a, b) has used this effect to infer just the polarity of the interplanetary field from 1926-1971. This study used primarily Godhavn H data prior to 1962 (Svalgaard, personal communication, 1974). The resulting index had a rather strong geomagnetic bias prior to 1962 (Fougere, 1974; Russell and Rosenberg, 1974; Russell et al., 1974; Svalgaard, 1974) but was apparently quite free from this bias at later times. We note that the Y-solar magnetospheric component is a predictor of the polarity of the interplanetary field 85-90% of the time depending on averaging interval (Russell and Rosenberg, 1974) which is close to the accuracy achieved during summer months using Thule data (Campbell and Matsushita, 1973). Finally, there has appeared no study which rules out modification of this effect by the solar wind velocity.
4. Solar Wind Density
The magnetopause standoff distance is proportional to the square root of the solar wind dynamic pressure, other things being equal. The fact that the Earth's dipole is tilted leads to a diurnal variation in the surface field due to these currents (Olson, 1970). However, this effect is smaller than that of ionospheric currents and would be difficult if not impossible to use. The variation in the period of geomagnetic micropulsations as a function of the size of the magnetosphere has also been studied (Patel, 1969) but only a weak dependence has been found. In short, there seems little possibility in measuring the solar wind dynamic pressure and hence the solar wind number density, given other techniques for finding the velocity.
5. The 22-yr Cycle in-Geomagnetic Activity
The double sunspot cycle in geomagnetic activity found by Chernosky (1966) has been attributed by Russell and McPherron (1973b) to be due to the varying heliographic latitude dependence of the dominant polarity of the interplanetary magnetic field discovered by Rosenberg and Coleman (1969). This latitude dependence is such that there are more days of outward directed flux than inward above the heliographic equator and vice-versa below it during one solar cycle and the reverse situation the next solar cycle. The effect favors geomagnetic activity for one cycle and then diminishes it for the next. Both the variation in the interplanetary field (Wilcox and Scherrer, 1972) and the modulation of geomagnetic activity (Chernosky, 1966) are observed to change about 2 yr after solar maximum. We note that the purpose of the Russell-McPherron model was not to explain the Chernosky observation but rather the semiannual variation of geomagnetic activity which we will discuss in a later section. The cause of the heliographic latitude dependence of the dominant polarity of the interplanetary field has been attributed to a solar magnetic dipole, and indeed the polar field of the sun has been observed to reverse from solar cycle to solar cycle.
In an attempt to determine whether the heliographic latitude dependence was discernible in old geomagnetic records, Russell (1974) examined the amplitude of the 22-yr cycle in the Ci index. He found that the 22-yr variation as from 1885-1907 was similar to the variation during the present epoch, but Much weaker from 1907-1948. Unfortunately, the Ci index is a somewhat subjective index and, while it is unlikely that the index had a 22-yr periodicity, it cannot be used to measure the long term trends in the absolute level of geomagnetic activity. Recently, however, Mayaud (1973) has published an objective index called the aa index with constant calibration for the years 1868-1967.
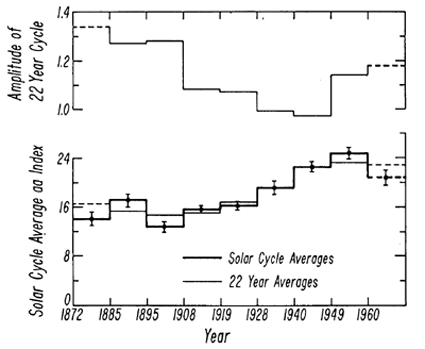
Figure 1 shows in the lower panel the solar cycle average (~11 yr) starting two years after solar maximum for the aa index (heavy line), together with the double solar cycle average (~ 22 yr) which removes the 22 yr periodicity. The double sunspot cycle average is centered on and calculated for each ~11 yr cycle. The upper panel shows the amplitude of the 22-yr variation. The error bars were obtained by finding the standard deviation from the average solar cycle variation. In every year in which the expected error does not overlap the running 22 yr average the variation is in phase with the double sunspot cycle variation extrapolated backwards from present in situ observations. The probability of this occurring by chance is 3%. Alternatively, we may compare with the hypothesis that there are three states occurring at random: zero amplitude, large amplitude in phase with expectations; and large amplitude out of phase with expectations. The probability of the situation occurring as in Figure 1, in which no periods of large amplitudes out of phase with expectations are present in 9 cycles, is again 3%. Thus, the aa index data confirm the existence of the 22-yr cycle.
Examining first the running 22-yr average (light line), we see a slow decrease from 1872 to around 1908, at which time activity first slowly and then rapidly increases peaking from 1949 to 1960. We note that there is a rather sizeable change in the aa index from the 1900's to the 1950's, roughly 60%. This could be due, as mentioned above, to either an increase in the solar wind velocity or the interplanetary field strength or its variability.
| Fig. 1.Long term variation of geomagnetic activity as deduced from the aa index (Mayaud, 1973). Lower panel: Heavy line is solar cycle average beginning two years after sunspot maximum. Fine line is filtered averages with single sunspot cycle variation removed. Dashed lines indicate incomplete data. Error bars are probable error in the means. Upper panel: The amplitude of the double sunspot cycle. |
The top panel of Figure 1 shows the amplitude of the 22-year variation, that is, the ratio between the 11-yr average and half the sum of the neighboring cycles, inverting every second ratio. The amplitude of the 22-yr cycle has also undergone a long term change; first, being large from 1872-1908; then diminishing, and, in fact, disappearing from 1928 to 1949 and then reaching moderately large values again in the modern epoch. Following Russell's (1974) interpretation of the Ci data, these results imply a long term change in the amplitude of the latitude dependence of the dominant polarity of the interplanetary magnetic field, the simplest explanation of which is a long term change in the Sun's polar magnetic field strength. Thus, it seems likely that the Sun's polar magnetic field often exceeds the values of the present epoch, while at other times it appears to be much less. While this in itself is not an unexpected result, it is interesting that there seems to be a slow modulation of the amplitude rather than a random change from solar cycle to solar cycle. We note that this provides further support for the suggestion of Russell (1974) that the deviation of the phase of the annual wave in the Svalgaard index from that expected (Russell and Rosenberg, 1974; Russell et al., 1974) is due to the decrease of the amplitude of the modulation to a value below that detectable with the index rather than a further degradation of the index.
6. The Semiannual Variation in Geomagnetic Activity
One of the earliest recognized patterns in geomagnetic activity was its semiannual variation (cf. Cortie, 1912; Chapman and Bartels, 1940). Many theories have been proposed for this variation. One class of theories proposes that the properties of the solar wind vary with the heliographic latitude, thus causing the semiannual variation. If this were so then the interaction should be strongest about March 5 and September 5 each year. However, geomagnetic activity maximizes in late March and September each year. The other principal class of theories is the equinoctial hypothesis in which the orientation of the Earth's dipole axis relative to the sun controls the interaction in some way. If it were simply this one would expect a maximum about March 21 and September 21 each year. In fact the maxima are somewhat after these dates on the average (McIntosh, 1959) and sometimes occur in early April and October.
The model proposed by Russell and McPherron (1973b) has aspects of both classes of theories. Realizing that the solar wind flow and the interplanetary magnetic field were ordered relative to the solar equator, while the interaction with the earth was ordered in magnetospheric coordinates, they computed the average strength of the interaction as a function of time of year for an ideal spiral field and obtained a variation similar to that observed. They also noted that the phase and amplitude of the interaction depended also on solar cycle according to the phase of the Rosenberg-Coleman effect. The top two panels of Figure 2 show the semiannual variation for a simple 5 nT spiral field and for such a field modulated according to the observations of Rosenberg and Coleman. Murayama (1974) noted that the variability of the real field would diminish the amplitude of this effect. This is shown in the middle panel of Figure 2 for an interplanetary field with a root mean square deviation of 2.3 nT perpendicular to the ecliptic plane. The phase, of course, is unaffected by this variability.
While the semiannual variation maximizes on the average about 10 days earlier than predicted by the Russell and McPherron model, this did not concern them because of the postulated and observed large variability of the phase. However, Murayama suggested that a heliographic latitude modulation of solar wind parameters was also present. This can, indeed, improve the agreement between theory and observation as shown in the bottom panel for a 25% modulation of the strength of the interaction. This could be due to changes in the velocity, field strength and/or variability of the field.
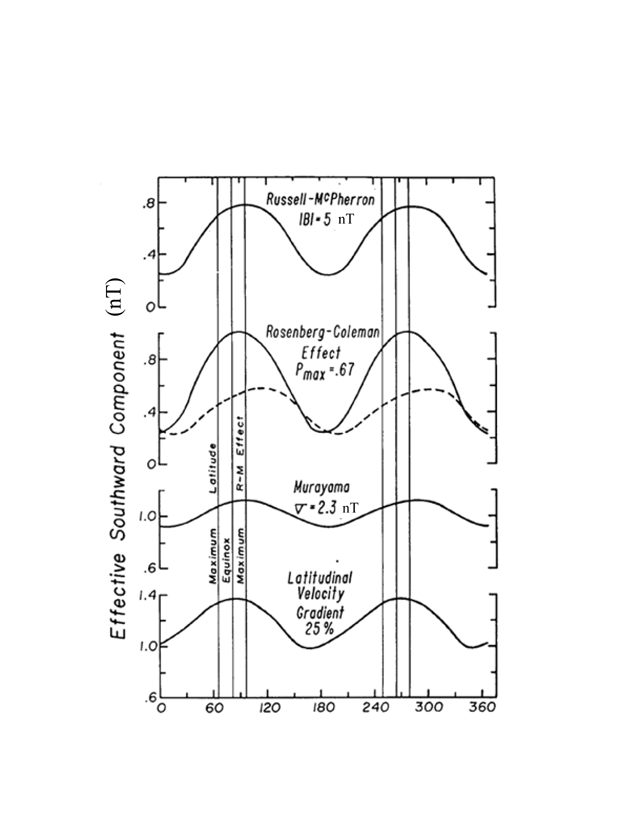 | Fig. 2. The effective southward component of the interplanetary magnetic field for various simplified models. Top panel: Interplanetary magnetic field is along Archimedean spiral, equally inwards and outwards, and magnetosphere is a half wave rectifier interacting only with southward fields. Second panel: Same as top panel, except that probability of inward and outward directed field modulated according to heliographic latitude of Earth. The heavy line corresponds to a field that is toward the Sun 67 % of the time on March 5 and 33 % of the time on September 5. The dashed line corresponds to the reverse situation. Third panel: Same as top panel, including variability of interplanetary field. Bottom panel: Same as the third panel except that solar wind velocity assumed to increase with heliographic latitude in both directions from the equator and that geomagnetic activity was proportional to the first power of the velocity. |
From the above discussion, it is apparent that many factors influence the amplitude and phase of the semiannual variation of geomagnetic activity, and one might despair of deducing much from this variation. Nevertheless, it is of some use if we first eliminate the Rosenberg-Coleman effect by averaging over double solar cycles. Murayama (1974) has done this and found the amplitudes and phases shown on tile harmonic dial in the lower right-hand panel of Figure 3. This shows a progressively stronger semiannual variation occurring earlier in the year as the sunspot number decreases (with the exception of the very highest sunspot numbers). To mimic this behavior in our model, we must have both a fluctuating interplanetary field and a heliographic latitude dependence. The upper left-hand panel shows the effect of a semiannual modulation in phase with the heliographic latitude dependence with zero deviation of the field from the Archimedean spiral direction, that is, a non-fluctuating field. This model far from matches the observed behavior. However, as the remaining two models demonstrate, it is not possible to determine both the variability of the field and the percent modulation with our present lack of knowledge of the details of the interaction, since both models qualitatively behave as the observations. However, we can deduce that the variability of the field must be a significant fraction of the field, and that the heliographic latitude dependence of the solar wind is a function of sunspot number, disappearing with large sunspot number. This has some import for the launching of any out-of-the-ecliptic missions.
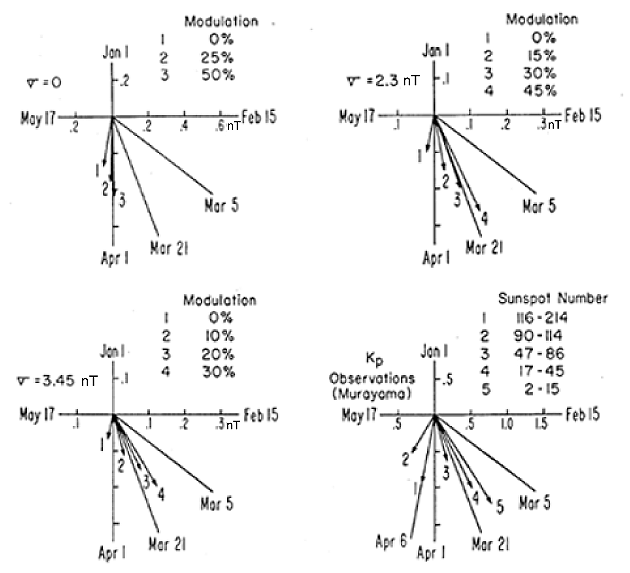 | Fig. 3. Harmonic dial of semiannual variation of geomagnetic activity according to three models compared with that observed by Murayama (1974). |
7. The Annual Variation
If the Sun had some north-south asymmetry in 'activity' such that one of the two hemispheres had a higher solar wind velocity, magnetic field strength or magnetic variability, then one would expect greater geomagnetic activity to occur when the earth is at its highest or lowest heliographic latitude which occur in fall and spring, respectively. Thus, if the southern hemisphere were more active in this sense, then spring should be more active geomagnetically.
Fig. 4. The spring to fall activity ratio observed in the aa index (Mayaud, 1973). Spring is assumed to consist of the months of March and April and fall of the months of September and October. Ratios with both preceding and following fall periods were calculated. Solid horizontal lines represent solar cycle averages over the same periods as in Figure 1. The error bars show the probable error in the mean.
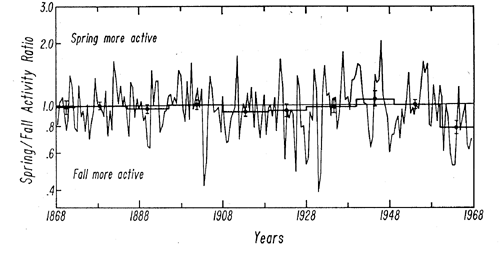 | Fig. 4. The spring to fall activity ratio observed in the aa index (Mayaud, 1973). Spring is assumed to consist of the months of March and April and fall of the months of September and October. Ratios with both preceding and following fall periods were calculated. Solid horizontal lines represent solar cycle averages over the same periods as in Figure 1. The error bars show the probable error in the mean. |
Again the Mayaud index allows us to examine this into the past. Figure 4 shows the ratio of the average aa index for March and April of each year to the average aa index for the preceding and following September and October over the 100 year duration of the aa index. Also shown are the solar cycle averages (geometric means) using the same epochs as in Figure 1 together with the probable error in the mean. These data suggest that there has been little long term north-south asymmetry in the properties of the solar wind and hence the Sun until relatively recent times. We note that the average from 1960-1968 is more than three standard deviations away from unity. This corresponds to a more 'active' northern solar hemisphere. We note that from July 1965 to mid-1967, the average solar wind velocity during the month around highest (northern) heliographic latitude exceeded that at the lowest (southern) latitudes by 9% (Hundhausen et al., 1971).
8. Summary and Conclusions
The exact form of the functional relationship between solar wind parameters and geomagnetic activity is not at present known. Thus it is not possible to make quantitative inferences about interplanetary conditions from geomagnetic records. However, future work in this regard may enable us to deduce from polar cap magnetograms at least one component of the interplanetary magnetic field which in turn we should be able to relate statistically to the interplanetary field strength and its variability. Since geomagnetic activity apparently depends on both the solar wind velocity and the magnetic field, we may then be able to deduce the long term average solar wind velocity. However, there appears to be no method to deduce the number density of the solar wind plasma.
Three types of heliographic latitude dependencies are also evident from geomagnetic records: the annual modulation of the dominant polarity of the interplanetary magnetic field; the semiannual modulation of the solar wind velocity, the interplanetary magnetic field strength, and/or the variability of the magnetic field; and north-south asymmetries in these same three parameters. The first effect can be seen in the amplitude of the 22-yr cycle in geomagnetic activity. The second effect is evident in the amplitude and phase of the semiannual variation of geomagnetic activity and the third effect in the annual variation of geomagnetic activity. These variations in geomagnetic records suggest first that there exists a solar dipolar field whose strength changes slowly with time but which reverses polarity every solar cycle. Second, the amplitude of the heliographic latitude dependence of the solar wind appears to vary with sunspot number, and third, there generally has been less north-south asymmetry in the solar wind in the past than in the most recent solar cycle. Finally, since an objective geomagnetic index, i.e., the aa index, shows a 63% increase from solar cycle 13 to solar cycle 18, it is obvious that some property, or properties, of the solar wind has significantly changed in that time.
Acknowledgment
This work was supported by the National Science Foundation under grant GA 34148-X.
References
Arnoldy, R. L.: 1971, J. Geophys. Res. 76, 5189.
Atkinson, G.: 1972, Magnetosphere-lonosphere Interactions (ed. by K. Folkestad), Universitetsforlaget, Oslo, Norway, p. 203.
Burton, R. K., Russell, C. T., and McPherron, R. L.: 1974, Publication Number 1329, Institute of Geophysics, University of California.
Campbell, W. H. and Matsushita, S.: 1973, J. Geophys. Res. 78, 2079.
Chapman, S. and Bartels, J.: 1940, Geomagnetism, Oxford Press, Oxford, Great Britain.
Chernosky, E. J.: 1966, J. Geophys. Res. 71, 965.
Cortie, A. L.: 1912, Monthly Notices Roy. Astron. Soc. 73, 52.
Ezer, D. and Cameron, A. G. W.: 1972, Nature 240, 180.
Fougere, P. F.: 1974, Planetary Space Sci. 22, 1173.
Fowler, W. A.: 1972, Nature 238, 24.
Friis-Christensen, E. and Wilhjelm, J.: 1974, EOS Trans. AGU 56, 1173.
Friis-Christensen, E., Larsen, K., Wilcox, J. M., Gonzalez, W., and Colburn, D. S.: 1971, Nature Phys. Sci. 233, 48, Sept. 20.
Friis-Christensen, E., Larsen, K., Wilhjelm, J., Wilcox, J. M., Gonzalez, W., and Colburn, D. S.: 1972, J. Geophys. Res. 77, 3371.
Garrett, H. B., Dessler, A. J., and Hill, T. W.: 1975, J. Geophys. Res., in press.
Heppner, J. P.: 1972, J. Geophys. Res. 77, 4877.
Hundhausen, A. J., Bame, S. J., and Montgomery, M. D.: 1971, J. Geophys. Res. 22, 5145.
Jørgensen, T. S., Friis-Christensen, E., and Wilhjelm, J.: 1972, J. Geophys, Res. 77, 1976.
Mansurov, S. M.: 1969, Geomagn. Aeron.. 9, 622.
Mayaud, P. N.: 1973, 'A Hundred Year Series of Geomagnetic Data 1868-1967', IAGA Bulletin No. 33, 255 pp.
McIntosh, D. H.: 1959, Phil. Trans. Roy. Soc. London A, 251, 525.
Murayama, J.: 1974, J. Geophys. Res. 79, 297.
Olson, W. P.: 1970, Planetary Space Sci. 18, 1471.
Patel, V. L.: 1969, Planetary Space Sci. 17, 1432.
Rosenberg, R. L. and Coleman, P. J., Jr.: 1969, J. Geophys. Res. 74 (24), 5611-5622.
Russell, C. T.: 1972, Critical Problems of Magnetospheric Physics (ed. by E. R. Dyer), IUCSTP Secretariat, Washington, D. C., p. 1.
Russell, C. T.: 1974, Geophys. Res. Letters 1, 11.
Russell, C. T. and Atkinson, G.: 1973, J. Geophys. Res. 78, 4001.
Russell, C. T. and McPherron, R. L.: 1973a, Space Sci. Rev. 15, 205.
Russell, C. T. and McPherron, R. L.: 1973b, J. Geophys. Res. 78 (1), 92.
Russell, C. T. and Rosenberg, R. L.: 1974, Solar Phys. 37, 251.
Russell, C. T., Burton, R. K., and McPherron, R. L.: 1975, J. Geophys. Res. 80, in press.
Svalgaard, L.: 1968, Danish Meteorological Institute, Geophysical Papers, R-6.
Svalgaard, L.: 1972a, Danish Meteorological Institute, Geophysical Papers, R-29.
Svalgaard, L.: 1972b, J. Geophys. Res. 77, 4027.
Svalgaard, L.: 1973, J. Geophys. Res. 78, 2064.
Svalgaard, L.: 1974, J. Geophys. Res., submitted 1974.
Wilcox, J. M. and Scherrer, P. H.: 1972, J. Geophys. Res. 77, 5385.
 Back to CT Russell's page
 More On-line Resources
Back to the SSC Home Page
More On-line Resources
Back to the SSC Home Page
The SSC web pages are maintained by Guan Le