------------------------------------------------------------------------------- Principal Investigator Margaret G. Kivelson Co-Investigators Paul J. Coleman Charles F. Kennel Robert L. Mc Pherron Christopher T. Russell David J. Southwood Raymond J. Walker Project Engineers Robert C. Snare Joseph D. Means Project Computer Specialists Neal Cline Steven Joy Todd King Project Science Support Krishan K. Khurana -------------------------------------------------------------------------------
The design of the Galileo magnetometer evidently presented many challenges. The requirement of high sensitivity is difficult to achieve on a complex spacecraft. Reliability, essential because of the prolonged duration of the mission with a six-year cruise preceding the beginning of the two-year mission, posed additional problems. Special requirements on the data coverage and format required development of a new approach to data-handling capabilities as noted above.
The design challenges described in the introduction were met in a variety of ways. We chose to fly a boom-mounted dual triaxial fluxgate magnetometer with ring core sensors in a flipper assembly.
We chose a fluxgate magnetometer because of its low power and its robust-ness, as well as because our laboratory has had experience on many missions with successful fluxgate operation. The ring core sensor was chosen because of its proven stability and low noise. The flipper assembly was included so that the sensor along the spin axis can periodically be rotated into the spin plane where its zero level can be checked. This feature also offers some redundancy. If the sensor along the spin axis were to cease operation, one of the two sensors could be rotated 90° to replace it. Then the three vector components could still be measured, albeit only once per spin period.
The need for extreme sensitivity was recognized not only in the instrument design but also in the design of the spacecraft which has a long boom to isolate the primary set of sensors from the magnetic fields generated by the complex spacecraft and its subsystems. A second set of sensors at a location roughly 2/3 as far from the spacecraft spin axis as the primary set was incorporated to measure the large fields of the inner Jovian magnetosphere and to assist in the identification of spacecraft fields (Ness et al., 1971). Spacecraft fields will decrease in magnitude with distance from the spacecraft and will often be related to specific spacecraft activities. Such magnetic fields can be characterized to first order by using data from both the inboard and outboard sensors if it is assumed that the field sources are localized dipoles; the data can then be corrected by removing the contributions of locally-generated fields.
The sensitivity of the magnetometer is needed not merely to measure small magnetic fields but also to measure small variations of the field in a large background magnetic field. This requirement cannot be met with an instrument that has low fractional resolution in any one range but many operating ranges; instead the instrument must have both a large dynamic range and high resolution. This need was met by using a high precision A/D converter with 12-bit digitization and 15-bit accuracy. Averaging data with this accuracy prior to telemetry increases the effective resolution of the measurements. Our careful plans for achieving high sensitivity could be frustrated by the presence of significant sources of oscillating spacecraft fields in the band-width of the magnetometer. A careful program of magnetic testing, shielding, compensation, and proper cable design for the entire spacecraft was undertaken to insure spacecraft magnetic cleanliness and thus to preserve magnetometer sensitivity.
The requirement for extreme reliability was met in several ways. The use of separate inner and outer sensor assemblies adds some redundancy and so does the flipper, as mentioned above. In addition to guarding against failure, one also has to be aware of changes in instrument operation. As the spacecraft spins, the gains and relative phases of the sensors in the spin plane can be intercompared. The flipper can be used to bring the spin axis-aligned sensor into the spin plane so its gain and phase can also be determined. An internal calibrate signal referenced to the instrument's A/D converter is also included. This signal reveals any changes in the operation of the analog portion of the magnetometer. The pointing of the sensors may change during the mission because the sensors are mounted on the end of a very long boom whose orientation may be temperature sensitive and may be affected by spacecraft maneuvers. Corrections for such changes can be made by using the clearly measurable magnetic signal produced by a fixed coil (called the MAG Cal Coil) mounted on the side of the spacecraft at the end of the boom, as we discuss in a section on instrument calibration.
In many respects the design problems of the digital portion of the magnetometer are similar to those found in building a high fidelity sound system. Signal fidelity must be preserved. To preserve the signal, two aliasing problems must be addressed before the signals are transmitted. First, signals outside the telemetry bandwidth, as given by the Nyquist frequency (half the sample rate), must not enter the analog to digital converter. This is accomplished by analog filtering before digitization. Secondly, on a spinning spacecraft, signals in the ambient medium polarized clockwise and counter-clockwise about the spin axis are detected at different frequencies. Depending on signal conditioning in the telemetry process, the amplitude and phase relationship of these two circular components of a single ambient signal can be altered. The signal processing procedures adopted minimize the distortion of the low-frequency signal, a point to which we return following a description of the on-board data processing.
The service function of the magnetometer requires that pertinent data be readily available to other experimenters. Our solution is to calculate physically meaningful data on-board the spacecraft and put those data into the telemetry stream. We can, by command, despin our data on-board to produce high time-resolution despun data required by other spacecraft instruments. We note that in order to obtain accurate despun data, the instrument operation must be monitored carefully and calibration constants in the instrument memory updated as necessary. As mentioned, we also routinely obtain despun vector data averaged over approximately 30-s intervals and transmit this information in the subcommutated data. When these data arrive at Earth, they can be immediately displayed and used by all experimenters without further computer processing. This feature supports rapid analysis of the data both for mission planning purposes and for public information purposes.
Finally, the scientific requirement for continuous data in the face of possible intermittent spacecraft tracking led us to store 200 vectors of averaged data for later transmission. The available storage registers also permit us to use the full bandwidth of the magnetometer to store limited intervals (7 s per hour) of 30 samples per second data that we call snapshots for later transmission. The snapshot memory can store 210 vectors. In short, the design requirements for the Galileo mission were met with the development of a sophisticated magnetometer with redundancy, cross-checks, internal computational power, and data storage.
The magnetometer has a separate electronics box containing digital and analog electronics and power supplies, located in electronics Orbiter bay number three, and two flipper assemblies and their ring core sensors mounted on a boom or 'astromast' deployed from a canister mounted on the science boom. Below we describe in more detail these various sub-assemblies, the instrument modes, calibration methods, and the on-board data processing.
The sensors (Figure 1) in each triad are oriented so that one is closely aligned along the spin axis of the spacecraft and two sensors lie with orthogonal orientation in the spacecraft spin plane. The individual sensors contain drive and sense coils surrounding a magnetically permeable core. Currents in the drive coils drive the permeable core into saturation twice during each drive cycle, symmetrically positive and negative. An external field breaks the symmetry of the periodic core saturation, and sense coils detect the resultant harmonics of the drive frequency. The amplitude of the even harmonics are proportional to the component of the ambient magnetic field along the axis of the sense coils. The instrument senses the second harmonic signal, i.e., the harmonic of largest amplitude. A feedback current that nulls the external field is applied to a coil around the sensor so that the core operates in a zero field condition. Thus, the amplitude of the feedback current is proportional to the component of the external field along the sensor axis. The data system senses the analog voltage proportional to the feedback current and converts it to a digital signal which is transmitted to Earth.

Fig. 1 . Sensor assembly with cover removed showing mechanism. The bi-metallic springs with heaters that actuate the flipper mechanism are at the top of the assembly.
The basic sensors are ring core fluxgate sensors similar to those described by Gordon and Brown (1972). Each sensor assembly contains three orthogonally mounted fluxgate sensors and a flipping mechanism. The flipper mechanism rotates two of the sensors so that the non-spinning sensor parallel to the spacecraft spin axis may be exchanged with one of those mounted in the spin plane of the spacecraft. As mentioned above, such an exchange of sensor positions provides data for determination of the offset of the sensor parallel to the spacecraft spin axis.
The flipping mechanism is similar in design to that developed at NASA Ames Research center and used on Explorer 35, Pioneer 9, ISEE 1 and 2, and UK-AMPTE. The mechanism uses electrically heated bi-metallic springs and a series of levers to rotate the sensor shaft by 90 deg. and back again. A photograph of one of the sensor assemblies is shown in Figure 1.
The outboard sensor, mounted at the end of a deployable boom, is located 11.03 m from the spacecraft spin axis. The inboard sensor is mounted on the same boom at a distance of 6.87 m from the spacecraft spin axis. The locations can be seen in Figure 2.

Fig. 2. A model of the Galileo spacecraft with labels defining axes
The outboard sensors have dynamic ranges of +/- 32 nT and +/- 512 nT. The inboard sensors have dynamic ranges of +/- 512 nT and +/- 16 384 nT. The limitation to 2 ranges for each magnetometer assembly allowed us to optimize the design to achieve low noise levels and small offsets. The lower range of the outboard sensor was designed for use in the solar wind and in the distant Jovian magnetosphere and magnetotail. The higher range of the inboard sensor was designed for use in the inner magnetosphere of Jupiter, i.e., within ~12 RJ and to the closest approach at ~4 RJ. The common +/- 512 nT range, with resolution of 0.03 nT, is appropriate for the middle and outer magnetosphere or the solar wind within 1 AU. This is the range that will be used for dual magnetometer estimation of the spacecraft field. The magnetometer to be operated, i.e., inboard or outboard and the desired dynamic range are selected by commands from the Earth.
The electronics unit housed within the spacecraft contains the drive and sense electronics of the sensors, analogue-to-digital converters, a microprocessor, and power conditioning and control circuitry. The electronic system is constructed of semiconductor circuits that will withstand the radiation environment of the Jovian magnetosphere. The analog circuits are constructed on double-sided printed circuit boards with plated-through holes. The data system is constructed on planar stitchwire circuit cards. The electronic circuit cards are mounted on a standard sub-chassis shelf which is mounted in the Galileo electronic bay. The physical characteristics of the system are given in Table II.
------------------------------------------------------------------------------- Sensors Mass 0.72 kg Dimensions 8.1 cm (diameter), 16.0 cm (length) Power 4.35 W for 4 minutes to activate flip Electronics Mass 3.98 kg Volume 14.6 x 17.8 x 41.8 (cm)^3 Power 3.9 W Dynamic Range Inboard magnetometer +/- 512 nT and +/- 16,384 nT Outboard magnetometer +/- 32 nT and +/- 512 nT -------------------------------------------------------------------------------
The electronics unit contains an analog circuit board for each of the six fluxgate sensors. These circuits provide sensor excitation currents, amplification, filtering, and second harmonic detection. The magnetometer circuits are similar to those used for the Pioneer Venus Magnetometer, reported by Snare and Means (1977). Changes were made to adapt the circuits to radiation-tolerant semi-conductors and to reduce power consumption. The output of each circuit is an analog voltage that is linear with the measured magnetic field at the sensor. The data system contained in the electronics unit is microprocessor controlled. Figure 3 shows a photograph of the electronics system.

Fig. 3. Electronic chassis of the magnetometer. The six analog magnetometer boards are on top of the chassis. The digital data handling circuits are on the lower side.
Figure 4 shows the block diagram of the system. In the block diagram those blocks residing above the internal bus, i.e., central processor (CPU), read only memory (ROM), and the random access memories (RAM), form a standard configuration microprocessor system using the 1802 family of integrated circuits. The hardware multiplier is a separate logic circuit that performs 8-bit multiplications at a high rate thus enhancing the capability of the microprocessor to process data rapidly. The flipper control, analog power control, and internal calibrate circuits are switches that are set by the micro-processor in response to ground commands. The power regulator and memory 'keep alive' circuit are power conditioning circuits that receive power from the spacecraft's alternating current power bus. The multiplexer, analog to digital converter (MUX-ADC) collects analog data under microprocessor control from the magnetometer circuits and from internal monitors of voltage and temperatures.

Fig. 4. Functional block diagram of the experiment.
Commands can be sent to the spacecraft to control instrument operation. Table III lists the commands and the frequency with which routine commands will be sent. Interactive commands are those that affect other subsystems on the spacecraft whereas non-interactive commands are internal to the MAG subsystem. Critical commands are those which select either the inboard or outboard sensor to make the measurements and determine whether the high-gain (low-range) or low-gain (high-range) measurements are desired. These selections are made by specific command, not selected automatically, in order to avoid a situation where changes in instrument mode are made in the middle of an important measurement. The selection of optimal averaging or snapshot mode determines which sort of data will be stored in the instrument buffer (see the discussion of these modes in the section on data processing). The memory load provides an updated table for the coordinate transformation that converts measurements into absolute field vectors in a specified orthogonal coordinate system. The remaining commands are related to special procedures that give the parameters needed to convert measurements into absolute field values in a known coordinate system. They are discussed in the next section.
------------------------------------------------------------------------------- Instrument mode Time or frequency ------------------------------------------------------------------------------- Interactive commands: Instrument power on/off On prior to boom deployment Flipper power on/off Start/end flipper checks Flip right, Flip left For flipper checks Flip (a toggle command) (affects power consumption when activated) Non-interactive commands: Inboard power on/off Few/orbit Outboard power on/off Inboard/Outboard sensor select Few/orbit Hi range/low range select Few/orbit Despin select (on/off) On change of sensor, flip position, gain, averaging interval Optimal averaging (on/off) When no real time or taped low rate data Snapshot mode (on/off) off/on command every ~40 min Memory load as needed to update The coordinate transform matrix/averaging interval Internal calibration coil Weekly during cruise, twice per signal (on/off) orbit at Jupiter Interactive (calibration) commands using programmed sequences: Offset checks/Flipping sensors Weekly Constant slew once/orbit MAG Cal Coil (on/off) Following major engine burns and twice per orbit at Jupiter -------------------------------------------------------------------------------
The instrument processes data in two ways. In normal operation, the data processor demodulates the data to remove the effect of spacecraft spin and resolves it into an orthogonal system before transmitting the averages to the spacecraft data system. This process is described in greater detail below. Alternatively, direct measurements from each sensor can be sampled and averaged in even increments of time for transmission to the spacecraft data system. The latter method would require 'despinning' of the data on the ground and would be used only as a backup procedure or for instrument calibration as discussed below.
The internal calibrate signals drive prescribed currents through internal coils around the sensors and are used to determine instrument gain. In addition, the measurement must be corrected for slight misalignment of the sensors from the nominal orthogonal orientations. For this purpose, the data are used without despinning. A small amplitude modulation at the spacecraft spin period of the field in the sensor nominally aligned with the spin axis indicates misalignment. The measurements can readily be corrected to remove the oscillatory signal and obtain the true spin-axis component of the ambient field. Sensors precisely in the spin plane will record fields modulated at the spacecraft spin frequency. If offsets have been corrected and stray spacecraft fields are negligible, such signals average to zero over integral numbers of spins for steady background fields or if averaged over long times. Any non-vanishing average field in the sensors nominally in the spin plane can be attributed to the rotation of spin plane sensors out of the spin plane. By confirming that this spin average is proportional to the component of B along the spin-axis, it is possible to confirm that corrections for offsets and stray fields from the spinning part of the spacecraft have been made properly. The data can then be corrected to yield the spin plane components of the ambient field. If the sensors in the spin plane are perpendicular to one another, the signals are in quadrature. Misalignment within the spin plane results in phase shifts. They can be readily identified and the data further corrected. The procedure outlined here provides components of the field along three orthogonal directions, but the absolute orientation of the axes in the spin plane remains uncertain. The remaining uncertainty is removed by measurement of a reference signal that identifies a direction within the spin plane. The signal is produced by a coil rigidly mounted on the spacecraft.
The MAG Cal Coil (MCC) is mounted at the center of the lower (+z) edge of the boom with its axis aligned with the center line of the boom axis. It is a 20" x 18" roughly rectangular coil of 117 turns. During MAG Cal Coil calibrations, the coil is driven at one of several selected frequencies with amplitude (outboard) of 4.5 nT; (at 0.5 and 0.75 Hz the signal is a square wave, and at 1.5 Hz it is switched on for 2/3 of each cycle). Because the frequency is known, the signal can be identified even if the field is not entirely quiet. The flexible choice of frequency allows for the possibility of noise sources on the spacecraft that may make it undesirable to operate in certain frequency bands. All else being equal, higher frequencies are desirable because natural background noise falls off with increasing frequencies. The MCC signal defines a reference direction in space, thus providing the required information to allow the sensor orientations to be well constrained.
The above procedure must be carried out for each sensor triad and for both flip positions of the sensor triad.
Fields produced by systems mounted on the despun part of the spacecraft cannot readily be differentiated from ambient fields. A special procedure has been designed to permit measurements of the magnetic signal of the despun portion of the spacecraft. Starting in dual spin mode, the relative spin rate of the despun portion of the spacecraft is gradually reduced until the spacecraft is in all-spin mode and the procedure is reversed until the spacecraft is once again in the dual spin mode. The procedure takes approximately four hours. The procedure is initiated by the constant slew command and will be carried out once per orbit at Jupiter.
Finally, offsets in the instrument itself can be identified by measurements made in the known field of the Earth's magnetosphere. This will be possible during the initial post-launch period and during the two subsequent flybys of Earth. Standard methods of identifying offsets through statistical analysis of tangential discontinuities in the solar wind will also be used.

Fig. 5. Data processing flow diagram. O-1 to O-4 are types of data readout available. When tracking is available, O-2 and O-3 readouts are both transmitted and O-1 is optional. Readouts O-4 are collected during intervals when tracking is not available and stored for later transmission. The abbreviation v/s is vectors/second. DSP-AVER-CONST and DSP-AVER-CTRL are parameters defined in the instrument command log, their use is discussed in the text.
A flow diagram of the data processing is shown in Figure 5. The system uses a 12-bit analog-to-digital converter that has been trimmed such that each bit is accurate to at least 1/4 of the value of the least significant bit. The data, sampled at 30 samples s-1, are filtered to provide 16-bit words, tests have demonstrated that these words are accurate to the 15th bit. This filtering is performed by the microprocessor system using a recursivefilter, a form selected for economy of implementation. The recursive filter algorithm is of the form,
![]() (1)
(1)
where Vj0 is the (output) value calculated from measurements prior to measurement j and Vji is the (input) value read in at measurement j. The value of A is set at 1/4 for the filter at this stage of the data processing. This filter gives a transfer function (not used in on-board processing) of the form,
 (2)
(2)
The relationship of A in Equation (1) to OMEGAc of Equation (2) is given by the expression,
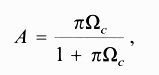 (3)
(3)
where OMEGAc = fc/fn and fn = Nyquist frequency = (2DT)-1, fc = the filter corner frequency and DT is the data sampling interval, 1/30s. This gives fc ~ 1.6 Hz, i.e., the filter cuts off frequencies above the telemetry Nyquist frequency, 2.25 Hz. At frequencies well below fc (including the range from dc through low multiples of the spin frequency) T is close to unit amplitude and has a small imaginary part.
The special problems associated with detection of signals in the ambient medium that are circularly polarized about the spin axis was alluded to in the introduction. A filter that is not flat for frequencies in a range between dc and low multiples of the spin frequency can distort ambient signals, especially near the spin frequency. The signal processing of Equation (1) does not distort signals in this range which lies well below fc. Next the data are corrected by subtracting the sensor offsets from the data and multiplying the data by a coordinate transformation matrix. This matrix contains sensor gain and pointing information. The correction routine yields accurate data at 3 vectors each 2/3 s (4.5 v/s) in true spacecraft coordinates. The information for the corrections, i.e., offsets and matrix values, is computed on the ground and sent via the command system as a direct memory load to the microprocessor memory.
In Figure 6, one hour of data is used to illustrate the results obtained by the different paths to the read-outs (O-1 to O-4) represented on the right side of Figure 5. The data are decimated to 3 vectors each 2/3 second for the low rate science data output which follows the path to O-2. These data may be commanded to be either in spacecraft coordinates or to be despun data in inertial coordinates. The spacecraft coordinates are defined with the spin axis +z pointing in the anti-Earth direction; the magnetometer boom is the +y axis, and the +x-axis completes the right-hand triad as shown in Figure 2. Figure 6(a) illustrates the non-despun data for the one hour sample interval. In this form, the data in the two spin plane directions (x and y) are modulated at the spacecraft spin period. These data were acquired at an early phase of operations and the spin-axis-aligned component, z, and the field magnitude show very small amplitude ripples at the spin period. Even this small amplitude ripple is later removed in ground data processing. Improved parameters have been developed and are now in use for on-board calibration.
To obtain magnetic field data in inertial (I) coordinates, the data are despun on board by multiplying the spacecraft (sc) frame Bx and By by sine and cosine functions generated from spacecraft roll information.
![]() (4)
(4)
![]() (5)
(5)
![]() (6)
(6)
The angle theta, the spacecraft roll angle, is measured from the projection onto the spacecraft spin plane of a southward pointing vector normal to the ecliptic plane.
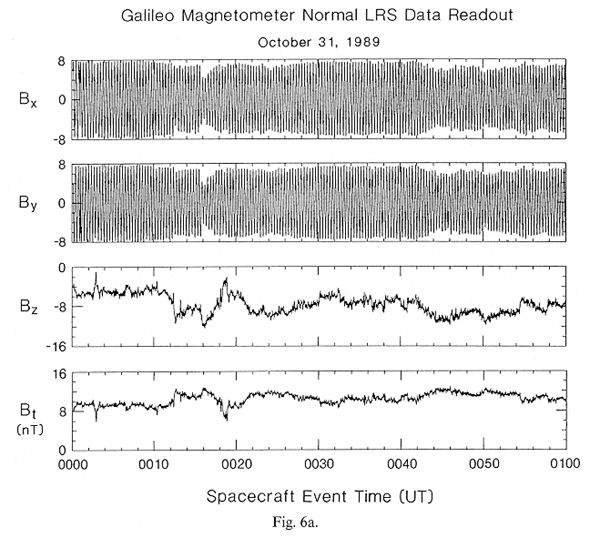
Fig. 6a
Fig. 6. One hour of data taken shortly after Galileo launch (00:00 to 01:00 UT on 31 October, 1989) illustrating different data formats available. (a) The low rate science data (4.5 vectors per second) in the spacecraft coordinate system. (b) The low rate science data of (6a) rotated into an inertial coordinate system. The despinning could have been done on board. (c) The despun averaged data processed on the spacecraft and transmitted as part of the low rate science data at a rate of 1 vector/(30 1/3 s). (d) The same data as in (a) presented as if the instrument had been in the optimal average mode with a sampling rate of 1 vector/(8 min). (e) A 7-s 'snapshot' within the hour. Here the samples are at 1/30 s intervals.
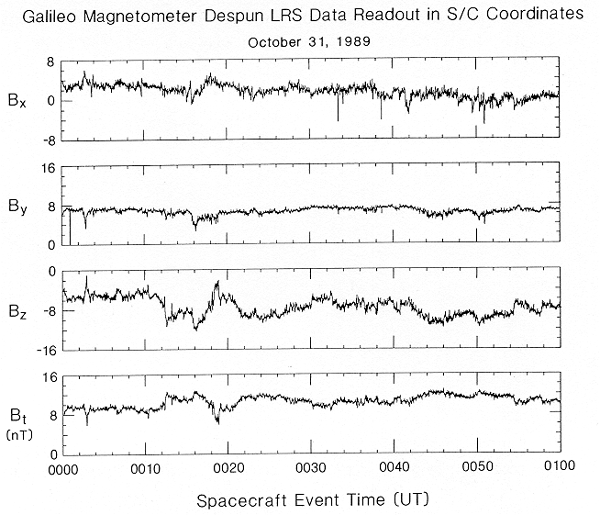
Fig. 6b
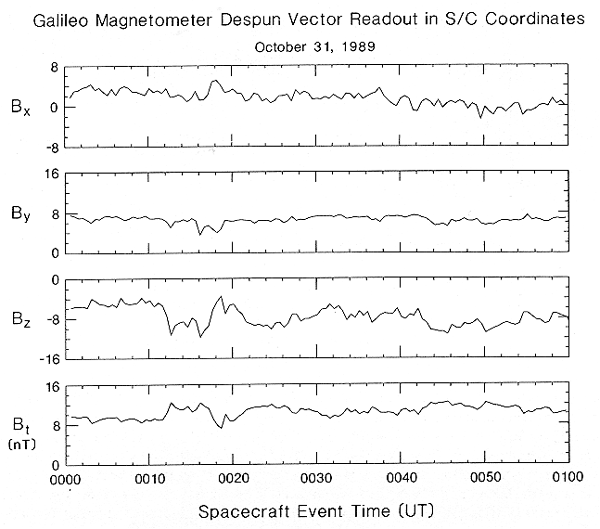
Fig. 6c
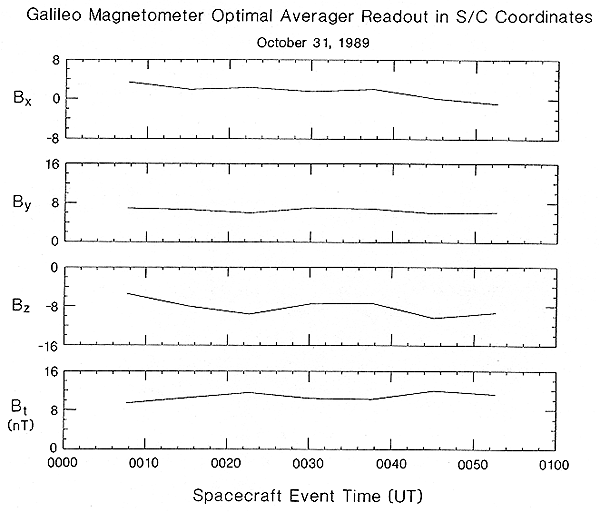
Fig. 6d
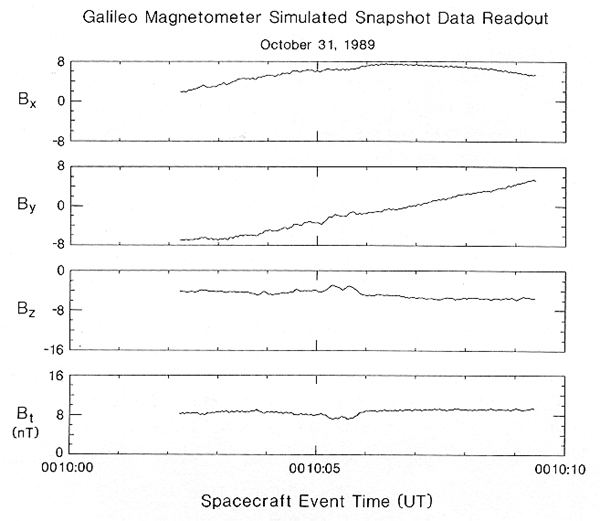
Fig. 6e
Therefore, in inertial coordinates positive BxI points south, normal to the ecliptic plane, positive ByI lies in the ecliptic plane in the sense of Jupiter's orbital motion and positive BzI is in the anti-earth direction. Figure 6(b) illustrates the results for the same input data if the instrument were operating in the despin mode. Note that the z-component, virtually aligned with the spin axis, and the total field have not changed but the large modulation at the spin period has disappeared.
Following the path in Figure 5 to O-3, despun data are again filtered and 2 vectors each minute (actually each 60 2/3 s) are provided in the subcommutated data. The filter is of the form given in Equation (1), with A = 512/32768. Figure 6(c) illustrates this lower resolution record for the same time interval. These subcommutated despun data are provided continuously, even when the main instrument output data are provided in spacecraft coordinates and give physically useful information directly from the experi-ment data record without any further processing.
For periods of up to a week during the cruise mode on the journey to Jupiter, the spacecraft data system may not be collecting data from the science instruments. During such times, the magnetometer will be left on. Then, following the path of Figure 5 to O-4, despun data will be averaged over times longer than the basic 30 s intervals and stored in memory. The averaging constant, A in Equation (1), is selected so that the memory will contain time and attitude information and 200 evenly spaced data points for the planned period between telemetry readouts. Commands set the parameter DSP-AVER-CONST of Figure 5, where A = (DSP-AVER-CONST)/32768 and the parameter ranges from 1024 for 1-min time resolution through 1 for 16-hr time resolution. This mode of operation is referred to as the optimal averaging mode. Figure 6(d) illustrates the output of the optimal average mode at 8-min time resolution for the same time interval.
The instrument memory can alternatively be used for recording short bursts of high speed data at 30 samples per second. This mode, called the snapshot, will be used for trying to capture transient events such as shocks or to increase the Nyquist frequency of the magnetometer measurements in order to provide a continuous spectrum of plasma waves from DC to frequencies that overlap the lowest frequency band of the Plasma Wave System (PWS). In Figure 5, this mode follows the path to O-1. The snapshot data come from the output of the digital averager at 30 samples per second. By inverting the operation of Equation (1), the original unfiltered input data are retrieved. The highest time resolution samples are not equispaced in time, the time-interval separating digitized values of the vector components is approximately 0.2 ms and the time lapse between successive vector samples is fixed at 33.3 ms. The buffer memory which contains the snapshot data (210 48-bit vectors and a time record) is continuously read out at 16 words per minute. The memory readout appears in the subcommutated MAG data. A seven second burst within the sample time interval is illustrated in Figure 6(e). As the spacecraft spin period is 20 s, the x- and y-components are modulated by the spacecraft spin, evident as a portion of a sinusoid.
The low rate science data format contains three vector sets of x, y, z samples and a sub-commutator word. Each word is 16 bits in length and the readout provides 160 bits each 2/3 of a second for a total readout of 240 bps. The time interval between the first and second, and second and third vectors is 233 ms. The time interval between the third vector and the first vector of the next minor frame is 200 ms. This slight asymmetry of sampling could not be avoided because of incongruity between telemetry and instrument data rates. Ground processing can be used to remove the undesirable features of non-uniform sampling when necessary for refined analysis. The approach is to break the non-equispaced time series of n elements into three equispaced time series of lower time resolution (666 ms). The elements of the three series are composed of elements 3i-2, 3i-1, or 3i, respectively, where i = 1, 2, ... , n/3. Each series is Fourier transformed. The concept of frequency folding is used to relate these Fourier transforms to the transform of an equispaced time series of 222 milliseconds resolution. The procedure requires the inversion of a set of 6 x 6 equations. Inverse Fourier transformation then produces the desired equispaced time series. Details are provided in Appendix 1.
The subcommutated data consist of 91 words, corresponding to a data rate of (60 2/3 s)-1. The sub-commutator contains 2 readouts of despun averaged data, 16 words of stored buffer data; the remainder is housekeeping information to determine the status of the instrument. Included in the housekeeping data are various power supply voltages, a readout of all commands, matrix values and all memory-stored constants that are transferred to the instrument from the command system, and memory checksums.
The magnetometer sensors and sensor electronics have been selected to achieve the lowest noise possible. However, as is true with many magnetometers, the limiting factors in instrument noise are the digitization noise of the analog-to-digital converter and electronic noise. The technique of averaging 12-bit data to obtain 16-bit words was used on magnetometers for ISEE 1 and 2 and successfully reduced digitization noise as described further by Russell (1978).
------------------------------------------------------------------------------- Range Measured Digitization Measured Resolution Noise Noise (nT) (nT) (nT2/Hz) (nT2/Hz) _________________ _________________ ______________________ 12 bit 16 bit at 1 Hz at 0.01 Hz ___________________________________________________________________________ +/- 16384 8 1/2 1.9 x 10⁻² 1 x 10⁻¹ < 1 x 10⁻¹ +/- 512 1/4 1/64 5.8 x 10⁻⁴ 1 x 10⁻³ < 4 x 10⁻² +/- 32 1/64 1/1024 3.6 x 10⁻⁵ 5 x 10⁻⁵ < 2 x 10⁻² -------------------------------------------------------------------------------
Table IV shows the resolution for each dynamic range of the magnetometer. The third column displays the calculated digitization noise for the 16-bit average. The noise measured in the laboratory at 1 Hz and at 0.01 Hz is shown in the last columns. The instrument noise may be lower than the table entries as ambient noise sources cannot be completely eliminated in the laboratory tests. The noise level at 1 Hz is close to the calculated digitization noise in the low dynamic ranges of the instrument. For the larger dynamic range of +/- 16 348 nT, the electronic noise of the system raises the measured noise above the digitization noise at 1 Hz by approximately one half decade. In this range, 1 nT corresponds to 300 micro-V which is of the order of the electronic noise of the circuits. Appropriately selected data from flight operation will be used to provide improved estimates of instrument noise levels.
Khurana et al. (1991) have shown that the power in the quietest spectra obtained from data in the lobes of the Jovian magnetosphere (where the +32 nT range is relevant) is of order 1 nT2 Hz-1 near 0.01 Hz. The lobe power falls off approximately like the inverse frequency, consistent with levels near 10-2 nT2 Hz-1 near 1 Hz, which will be readily detectable above instrument noise levels.
The magnetometer assemblies were calibrated repeatedly in the laboratory prior to launch, providing excellent initial calibration parameters which were loaded into the instrument memory prior to launch. Data from flight operation revealed that the calibration parameters in the flight configuration could be further improved. Appendix 2 describes the approach developed for in-flight calibration and gives examples of its application. Calibration must be done separately for the different operating modes of the instrument of which there are 8 (two sensor assemblies each with two flip orientations and two ranges). The calibration uses low rate science data (2/9 s sample-1) of which only limited intervals were available during the first year of operation; only two of the operating modes were fully calibrated before the first flyby of the Earth; for these modes, the calibrated data have achieved the desired levels of accuracy. The MAG Cal Coil wave form has been studied but the analysis of absolute sensor orientation has not been completed at this time.
At UCLA we are grateful to F. R. George and D. Dearborn who did the preliminary circuit design and final calibrations, and R. J. Walker who provided expert advice on many instrument-related issues. Excellent low noise sensors were supplied by R. Lundsten of Naval Surface Weapons Center, White Oak. The final design, packaging and fabrication was skillfully directed by D. Frankel and R. Mack of Westinghouse. We benefitted much from the advice of M. Larson of the Office of Naval Research and Ulrika Williamson, Douglas Clay, Maria Etchetgaray, Ralph Parish, Howard Eyerly, and Carol Polanskey of JPL.
Because of a mismatch between the instrument and spacecraft clock cycles, the magnetometer data received from the spacecraft in the low-rate science mode are not equispaced. The spacecraft returns 3 vectors every 0.666 s. The time spacing (DELTA t) between vectors 1 and 2 and vectors 2 and 3 is equal to 0.233 s, but the spacing between vectors 3 and 4 is equal to 0.200 s. Many applications (e.g. fast Fourier transforms, auto- and cross-correlations, convolution, etc.) require equispaced data. If one incorrectly assumes that the data are equispaced then the input signal is distorted. The distortion of the input signal increases with increasing input frequency, the most severe distortion occurring near the Nyquist frequency (2.25 Hz).

Fig. A1-1. Top panel: Amplitude spectra of the unequispaced series F(t) (broken line) and the equispaced time series digitized at 0.222 s resolution (solid line). Middle panel: Amplitude spectra of the linearly interpolated redigitized time series (broken line) and the equispaced time series (solid line). Bottom panel: Amplitude spectra of the time series redigitized by the present scheme (broken line) and the equispaced time series (solid line).
To study this effect, we sampled a sinusoidal signal of frequency f = 1 Hz with DELTA t = 0.222 s and at the irregular spacings of our magnetometer. The fast Fourier transforms of the two time series (treated as if the data were equispaced) are shown in the top panel of Figure A1.1. It can be seen that in the transform of the irregularly spaced series (dashed curve), there are ghosts of the input frequency at 0.5 Hz and 2 Hz in addition to the peak at 1 Hz. The transform of the equispaced data (solid curve) show only a peak at 1 Hz. If one linearly interpolates the irregularly spaced data at DELTA t = 0.222 s, ghosts still appear in the Fourier transform (Figure A1.1 middle panel), though their amplitude is diminished.
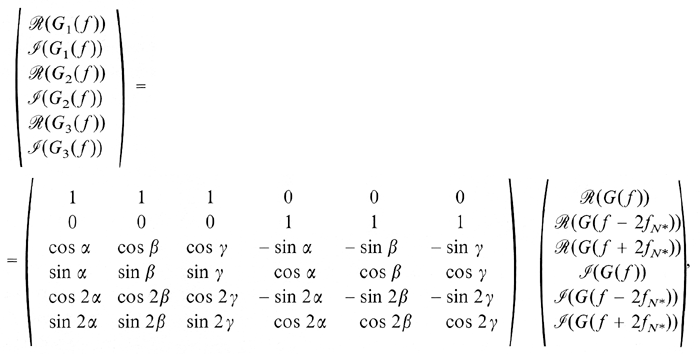
We have devised a redigitization scheme that takes advantage of certain properties (frequency folding, phase shifting) of the Fourier transforms to minimize the signal distortion. The technique consists of breaking the original time series into three equis-paced lower resolution (0.666 s) time series and recombining them in the frequency domain so that the inverse Fourier transform would yield an equispaced time series at DELTA t = 0.222 s. In our process we split the original time series F(t) into three time series Gi(t), i = 1, 2, 3 such that
G1(t) contains points 1, 4, 7, 10 ....... G2(t) contains points 2, 5, 8, 11 ....... and G3(t) contains points 3, 6, 9, 12 .......Notice that series G2 and G3 are equispaced with DELTA t = 0.666 s but are shifted from G1 by 0.233 s and 0.466 s, respectively. The objective is to combine the series G1, G2, and G3 to obtain a redigitized equispaced (DELTA t = 0.222 s) time series that we denote by G(t). If the Nyquist frequency of G(t) is fN = 2.25 Hz then the Nyquist frequency of the lower time resolution series is fN* (= 0.75 Hz). If G(t) had power in frequencies above fN*, then that information would be folded into frequencies below fN* in the spectra of Gi(t). In general the aliased power at a frequency f <= fN* can be written as (Kanasewich, 1975)
 (1)
(1)
As we are interested only in frequencies up to 3fN*, we will include terms only up to |n| = 1 in the above equation. Then G1(f) (the Fourier transform of G1(t)) is given by
G1(f) = G(f) + G(f - 2fN* + G(f + 2fN*). (2)For Fourier transforms G2(f) and G3(f), the frequency folding occurs in the same way but their elements also suffer a phase shift in accordance with the fact that for a Fourier transform pair, a shift of tau in the time domain translates into a phase change of 2*pi*f*tau in the frequency domain. Therefore,
![]() (3)
(3)
![]() (4)
(4)
Complex equations (2) to (4) can be rewritten in the matrix form as
 (5)
(5)
where alpha = 2*pi*f*tau, beta = 2*pi(f - 2fN*)*tau, gamma = 2*pi(f + 2fN*)*tau, and script R and script I denote the real and imaginary parts of the functions. There are six unknowns and six equations. By inverting the set of Equations (5) one can reconstruct the spectrum of G(f) which will have frequencies up to fN = 3fN* . The bottom panel of Figure A1.1 shows (dashed curve) the Fourier transform constructed in this way. Notice that the ghosts of the primary input frequency have vanished in the reconstructed spectrum and that the aliased power changes the amplitude below the Nyquist frequency by a negligible amount. An inverse Fourier transform of the reconstructed spectrum yields the desired equispaced data.
Galileo is scheduled to reach Jupiter in December 1995. The long idle time between the fabrication of the magnetometer and the launch of the spacecraft provided ideal opportunities to calibrate the magnetometer assemblies in the laboratory repeatedly with very high accuracy. Three different calibrations were performed over a period of four years and the gains and the relative angles of the magnetometer assemblies were obtained with an accuracy of 1 part in 104.
With the launch of the spacecraft in October 1989, operational data became available and the matrices available from the ground calibrations were tested and improved further. A scheme based on non-linear optimization through a gradient search method (Bevington, 1969) was adopted to obtain the elements of the coupling matrix and the offsets. To illustrate the scheme, let us assume that the data from the spacecraft are obtained in a rotating coordinate system (1, 2, 3) so that the measured components of the magnetic field are (B1, B2, B3). We identify directions 1, 2, and 3 as the 'look' directions of the sensors which are measuring field components almost along the two orthogonal spin plane directions of the spacecraft coordinate system (x and y) and along the spin axis (z), respectively. The objective is to calculate the magnetic field in a rotating coordinate system that is truly orthogonal with z strictly along the spin axis. The calculated field B = (Bz, By, Bx ) must also be corrected for offsets and gains. This requires us to know the elements of a 3 x 3 matrix (called a coupling matrix) and the offsets (O1, O2, O3) in the three sensors so that we can calculate
 (1)
(1)
The data are then despun into an inertial coordinate system (X, Y, Z) to obtain (BX, BY, BZ).
Data in this frame should normally not contain power at fspin, the spin frequency, or its harmonics at levels above background. The elements of the coupling matrix and the offsets are varied in order to minimize the amplitude of the spin ripple and its harmonics in one or more components of the vector field B in the inertial coordinate system (X, Y, Z) using enough data that power from fortuitous ambient signals at fspin is very small. One starts with some assumed values (either 0 for the minor elements and the offsets and 1 for the diagonal elements, or the parameters obtained from laboratory calibrations) and calculates the harmonic power. Then using a gradient search routine, one searches nearby regions of parameter space for the parameter set that minimizes the power at the spin frequency and twice the spin frequency in the data in the inertial coordinates. It can be shown that only 8 of the 12 unknowns in the above equation can be determined from schemes that minimize power at spin-related frequencies. For example, small changes in the element C33 which multiples the term (B3 - O3) make no first-order change in the amplitude of the spin ripple in Bz because the term (B3 - O3) itself contains very little spin ripple. Similarly, it can be shown that by using this technique, one can improve the estimate of c12 or c21, or a linear combination of them, but not both. The same is true of the pair c11 and c22. Offset O3 also cannot be determined from this method because an offset in the spin-direction sensor does not produce any spin ripple in the inertial coordinate system. This means that 4 parameters must be determined by other methods. Our initial approach is to set c12 and O3 to zero and c11 and C33 to values obtained from laboratory calibrations. We optimize the other 8 parameters. The Galileo magnetometer can flip sensor 3 from the spin axis into the spin plane. Data from the flipped configuration enables us the improve estimates of O3 . It can be shown that the effect of fixing c11 but letting c22 vary is equivalent to varying the gain of sensor 2 in terms of the known gain of sensor 1. Calibration coils internal to the magnetometer will be used to test the constancy of the sensor gains over time.
Once the elements of the coupling matrix have been obtained, we know the relative angles of the three sensors, but the information on the absolute orientation of the sensor assembly around the spin axis cannot be obtained by reducing spin-related power. To obtain the orientation of the assembly relative to the spacecraft axes, an external calibration coil mounted on the spacecraft is used. This coil generates a precisely known square wave that provides a spacecraft-fixed reference direction in the spin plane. This procedure yields further improvements in the elements c12 and c21.
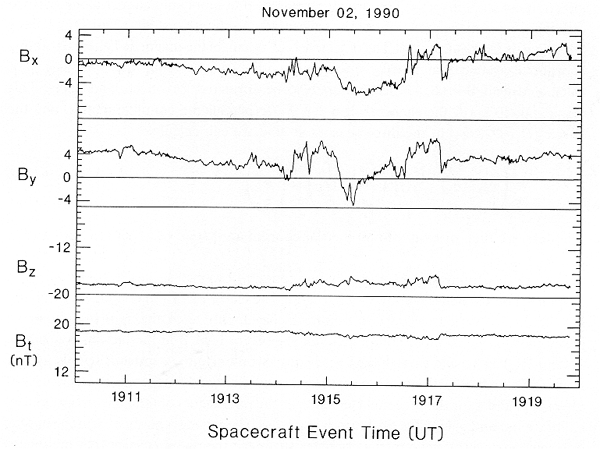
Fig. A2-1. Despun data obtained using the matrix and the offsets from the non-linear optimization technique.
We have successfully tested this scheme for several modes of Galileo magnetometer operations. The relative angles of the sensors obtained from this scheme are within 0.1° of the angles obtained from the laboratory calibrations. The optimization program itself is very simple and less than 10 min of computer time is required on a Microvax work station to obtain all 8 parameters from 5 hours of input data. To illustrate the quality of the output despun data, we show the application of the method to a data set obtained from Galileo about two weeks after the launch when the spacecraft was in the solar wind. Figure A2.1 shows the despun data with the best matrix and offsets obtained from the optimization scheme described above. The spin ripple in all three components is below the ambient background noise in the data. This accuracy was achieved when only a few days of magnetic data with spacecraft attitude information were available to determine the matrix elements and the offsets. Further improvements in the parameters can be anticipated when quieter intervals become available for examination.
Acuna, M. H., Behannon, K. W., and Connerney, J. E. P.: 1983, in A. J. Dessler (ed.), Physics of the Jovian Magnetosphere, Cambridge University Press, Cambridge, MA.
Belcher, I. W.: 1983, in A. J. Dessler (ed.), Physics of the Jovian Magnetosphere, Cambridge University Press, Cambridge, MA.
Bevington, P. R.: 1969, Data Reduction and Error Analysis for the Physical Sciences, McGraw-Hill Book Co., New York.
Birmingham, T. J.: 1983, Rev. Geophys. 21, 375.
Connerney, J. E. P.: 1987, Rev. Geophys. 25, 615.
Dessler,A.J.(ed.): 1983, Physics of the Jovian Magnetosphere, Cambridge University Press, Cambridge, MA.
Gehrels, T., (ed.): 1976, Jupiter, University Arizona Press, Tucson.
Gordon, D. l. and Brown, R. E.: 1972, IEEE Transactions on Magnetics MAG-8, 76.
Hill, T. W.: 1979, J. Geophys. Res. 84, 6554.
Kanasewich, E. R.: 1975, Time Series Analysis in Geophysics, University Alberta Press, Edmonton, Canada.
Khurana, K. K., Chen, S.-H., Hammond, C. M., and Kivelson, M. G.: 1991, Adv. Space Res., (in press).
Kivelson, M. G., Slavin, J. A., and Southwood, D. J.: 1979, Science 205, 491.
Krimigis, S. M. and Roelof, E.C.: 1983, in A. J. Dessler (ed.), Physics of the Jovian Magnetosphere, Cambridge University Press, Cambridge, MA.
Ness, N. F., Behannon, K. W., Lepping, R. P., and Schatten, K. H.: 1971, J. Geophys. Res. 76, 3564.
Russell, C. T.: 1978, IEEE Transactions on Geoscience Electronics GE-16(3).
Snare, R. C. and Means, J. D.: 1977, IEEE Transactions on Magnetics MAG-13(5).
Vasyliunas, V. M.: 1983, in A. J. Dessler (ed.), Physics of the Jovian Magnetosphere, Cambridge University Press, Cambridge, MA.
 Back to CT Russell's page
 More On-line Resources
Back to the SSC Home Page
More On-line Resources
Back to the SSC Home Page